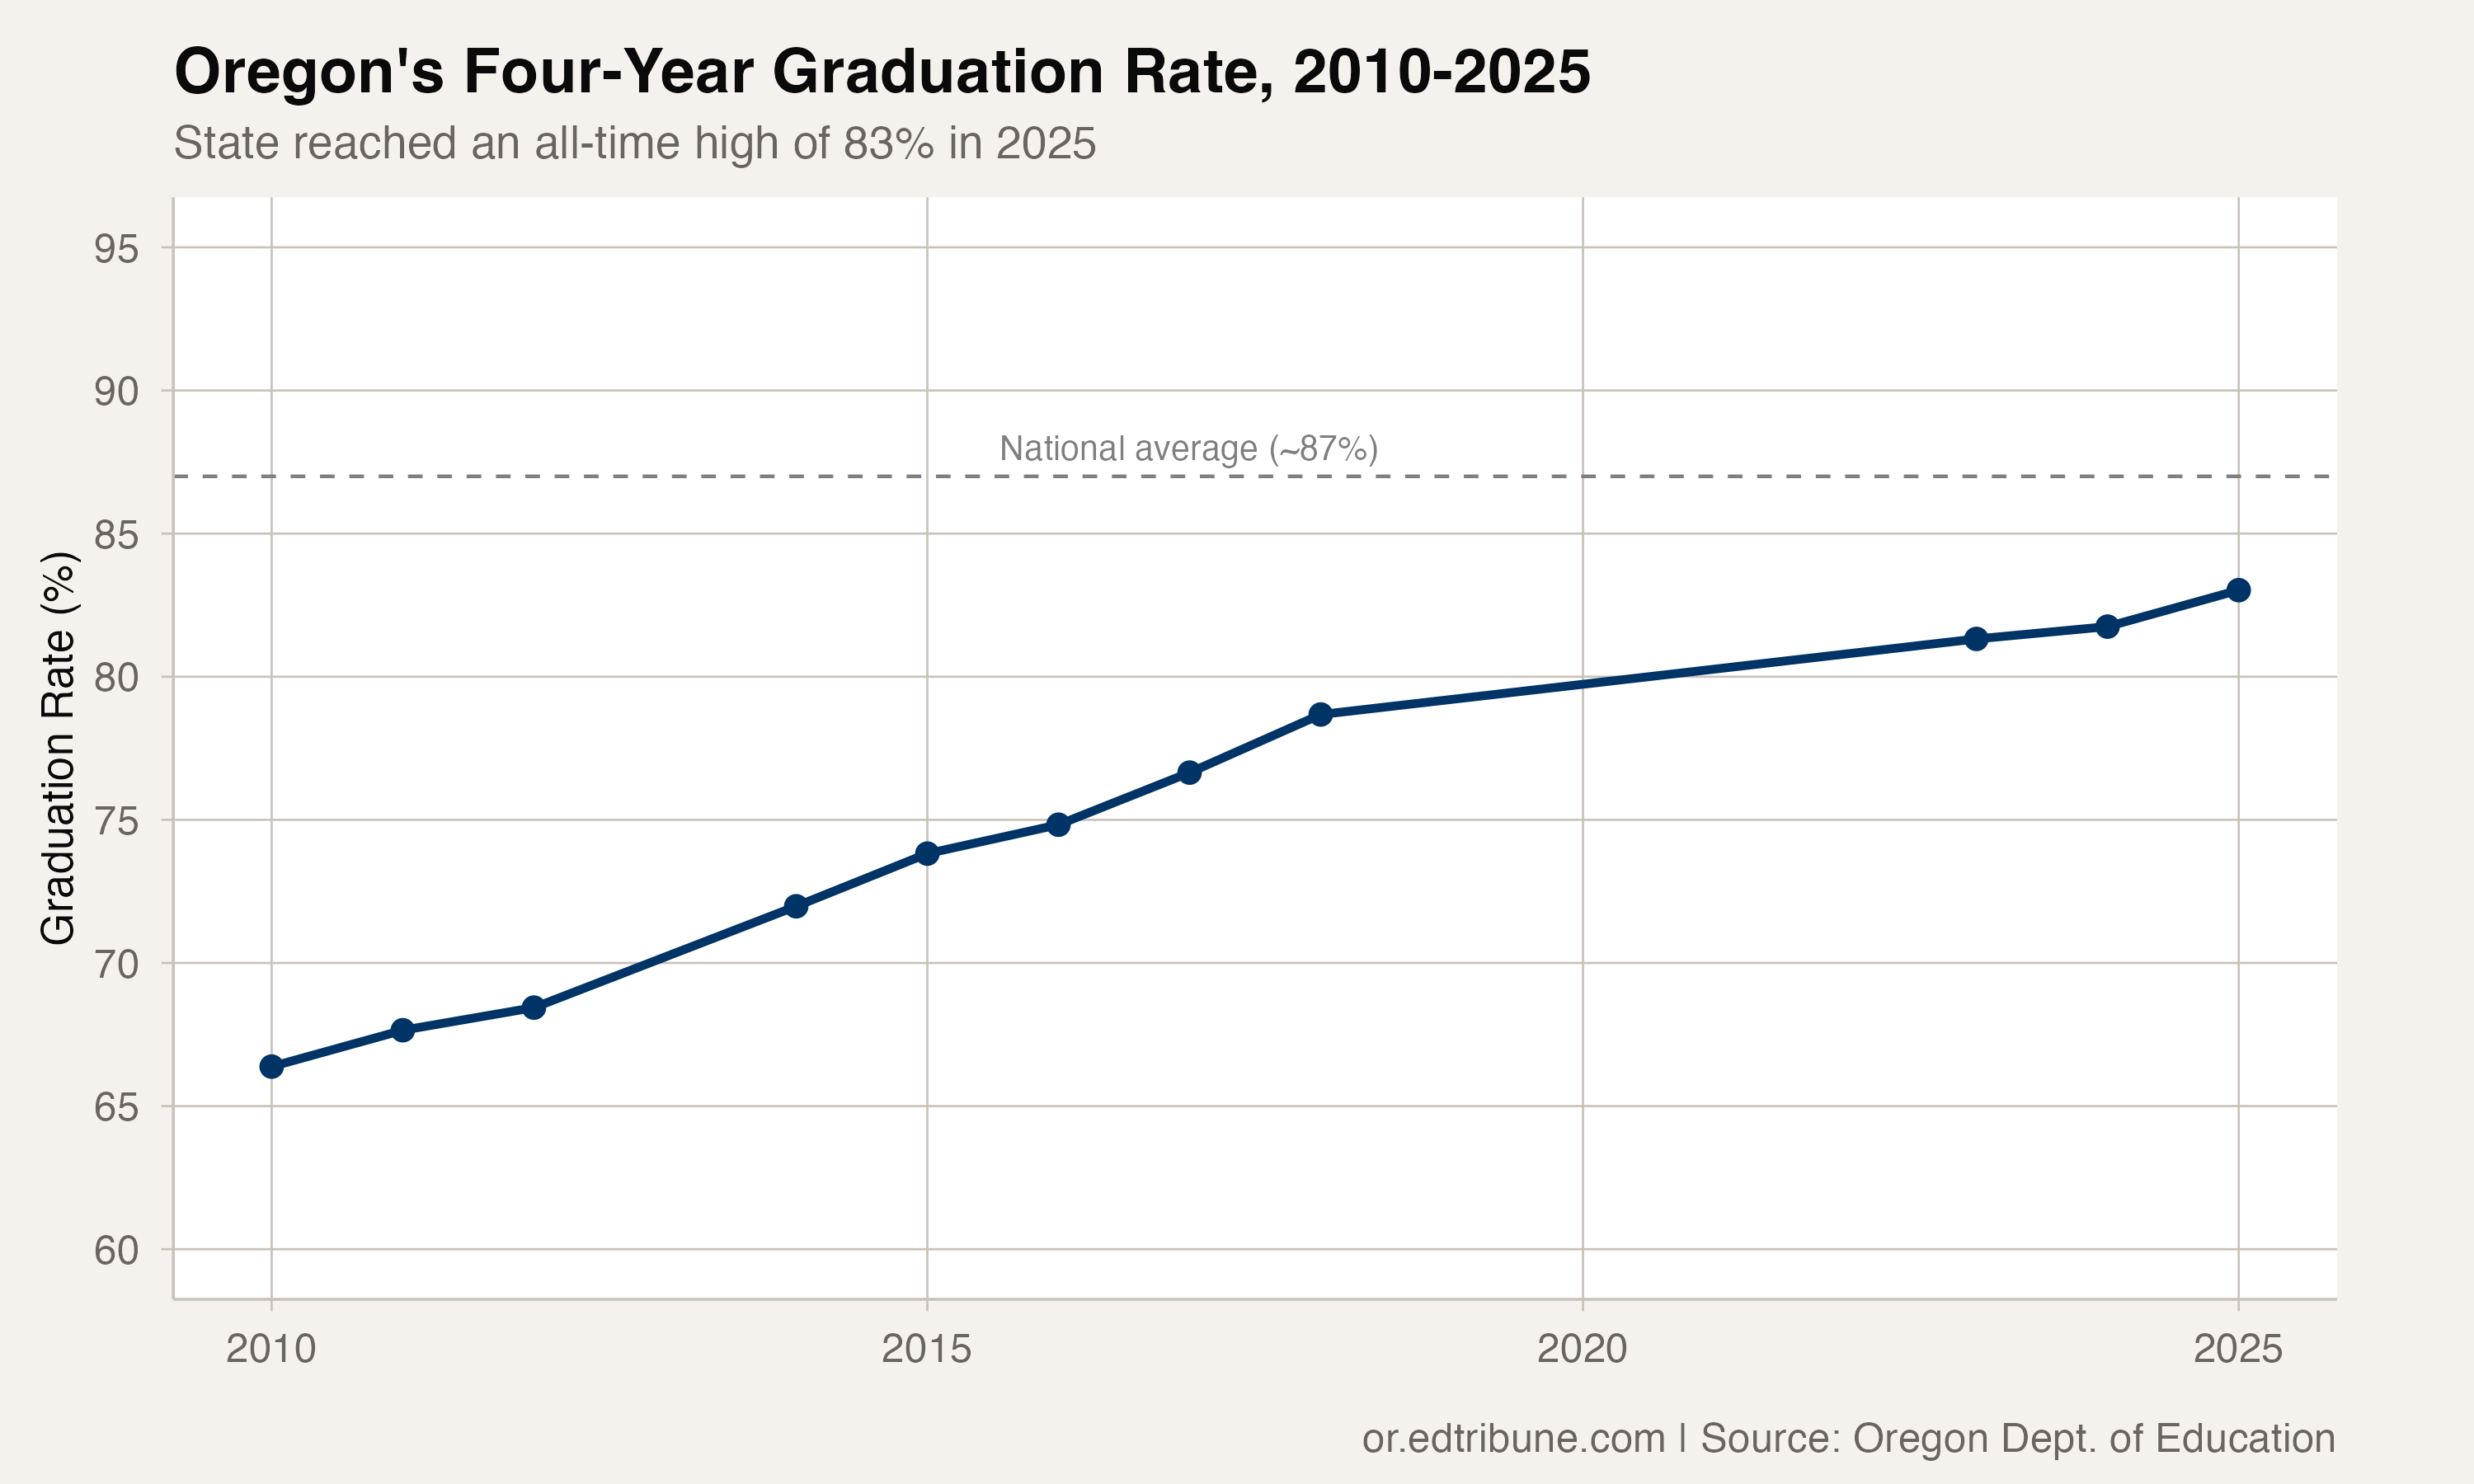
The Class of 2025 gave Oregon something it had never seen before: an 83% four-year graduation rate. That number, up from 66.4% in 2010, represents a 16.6 percentage point climb.
But records invite context. Oregon's all-time high still lands roughly four points below the national average of about 87%. And 83% means 17% of the state's 48,563 graduating seniors, about 8,200 young people, did not earn a diploma within four years.
Fifteen Years of Steady Gains
The trajectory has been steady. Oregon added roughly 1 to 2 percentage points per year through most of the 2010s, climbing from 66.4% in 2010 to 78.7% by 2018. The state then suspended comparable reporting during COVID (2019-2022), but when data resumed in 2023, the rate picked up at 81.3%, suggesting the upward trend continued through the gap years.
The most recent three years show:
| Year | Graduation Rate | Cohort Size | Year-over-Year Change |
|---|---|---|---|
| 2023 | 81.3% | 46,371 | — |
| 2024 | 81.8% | 47,430 | +0.4 |
| 2025 | 83.0% | 48,563 | +1.2 |
The 2025 jump of 1.2 points was the largest single-year gain since the data gap, suggesting the improvement engine has not stalled.
The 40-40-20 Goal and Its Shadow
Oregon's ambition was bigger than 83%. The 40-40-20 education goal, adopted in 2011, envisioned that by 2025, every Oregonian would have a high school diploma or equivalent, 40% would hold a bachelor's degree, and 40% would have an associate's degree or certificate. Universal high school completion was the baseline expectation.
The state got closer than many expected. But the gap between 83% and 100% represents roughly 8,200 students per year who still don't finish on time. Some of those students will earn diplomas through extended or modified pathways. Others will not.
Beneath the Headline: Who Graduates and Who Doesn't
The statewide 83% masks enormous variation by subgroup. Career and Technical Education concentrators lead at 97.8%, while incarcerated youth trail at 42.9%. That is a 55-point spread within the same state, the same year.
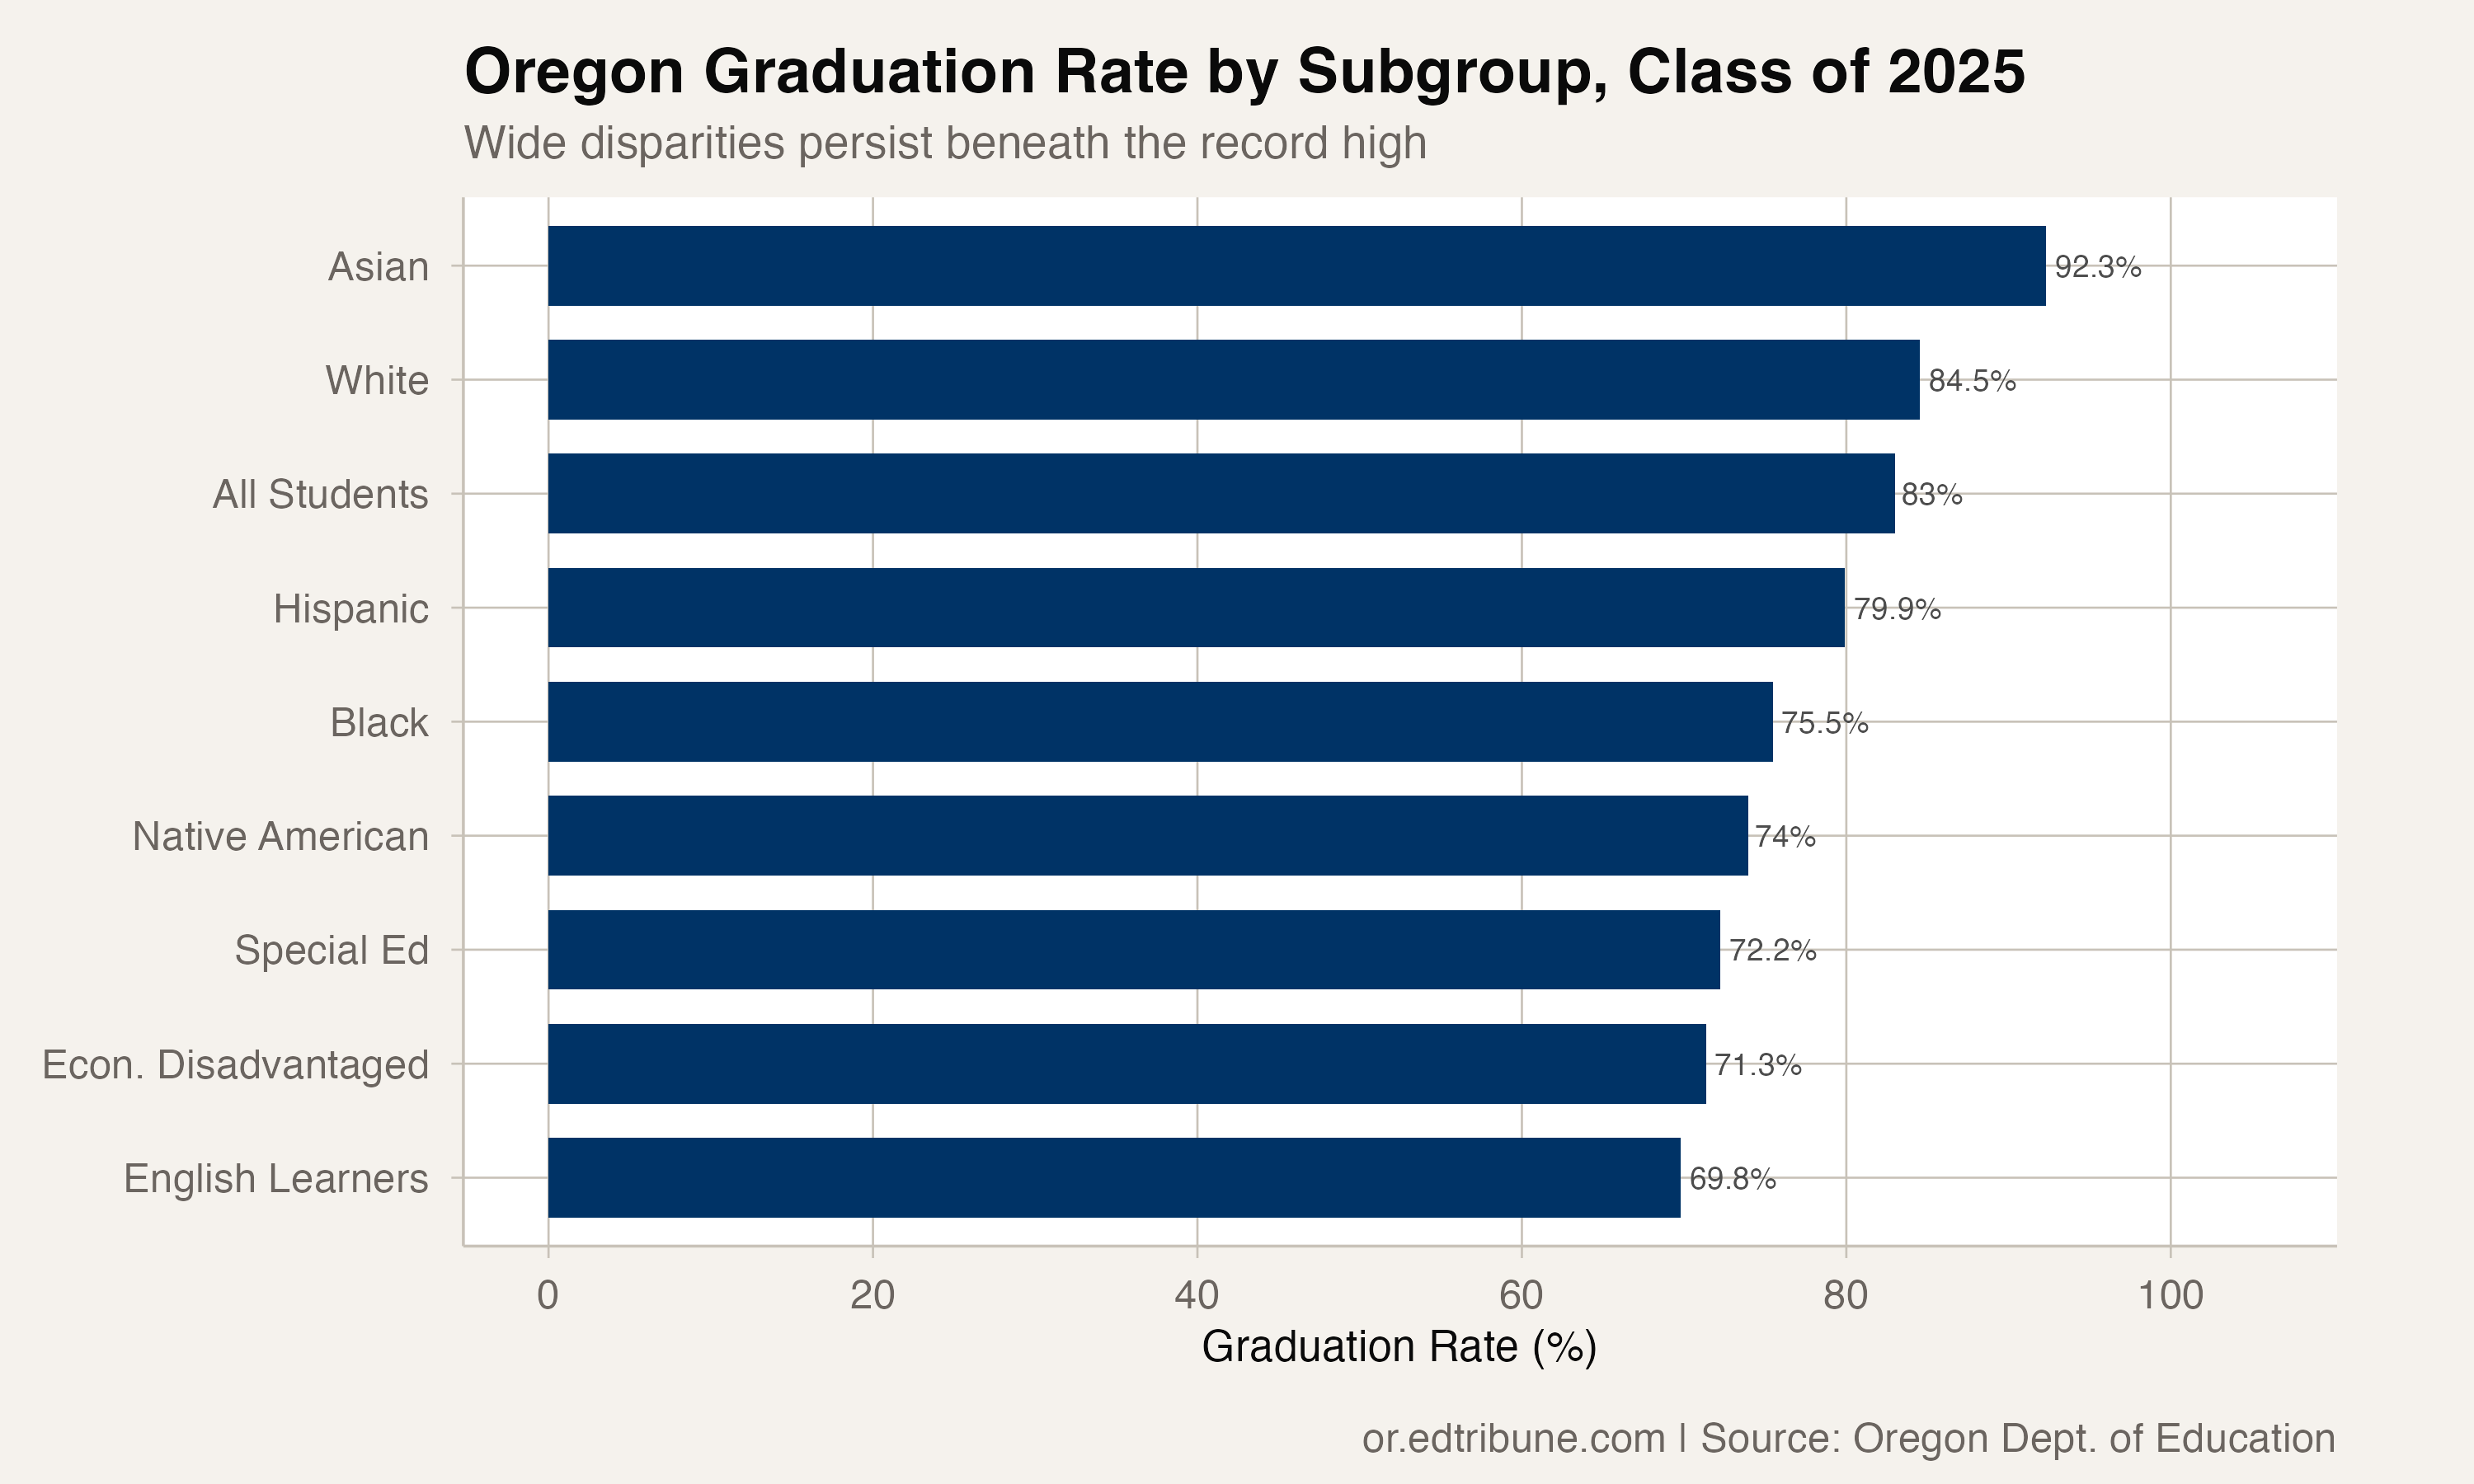
Asian students graduate at 92.3%, white students at 84.5%, and Hispanic students at 79.9%. Black students have reached 75.5%, a 25.6 percentage point gain from 2010 but still 7.5 points below the state average. Native American students graduate at 74.0%, special education students at 72.2%, and current English learners at 69.8%.
The most vulnerable populations face the steepest odds: foster care youth graduate at 54.4%, pregnant or parenting students at 53.9%, and incarcerated youth at 42.9%.
The Gains That Matter Most
Not all improvement is created equal. Special education students gained 30.5 percentage points since 2010, the largest subgroup improvement in the data. Black students gained 25.6 points, Hispanic students 24.7 points. White students, starting from a higher baseline, gained 14.6 points.
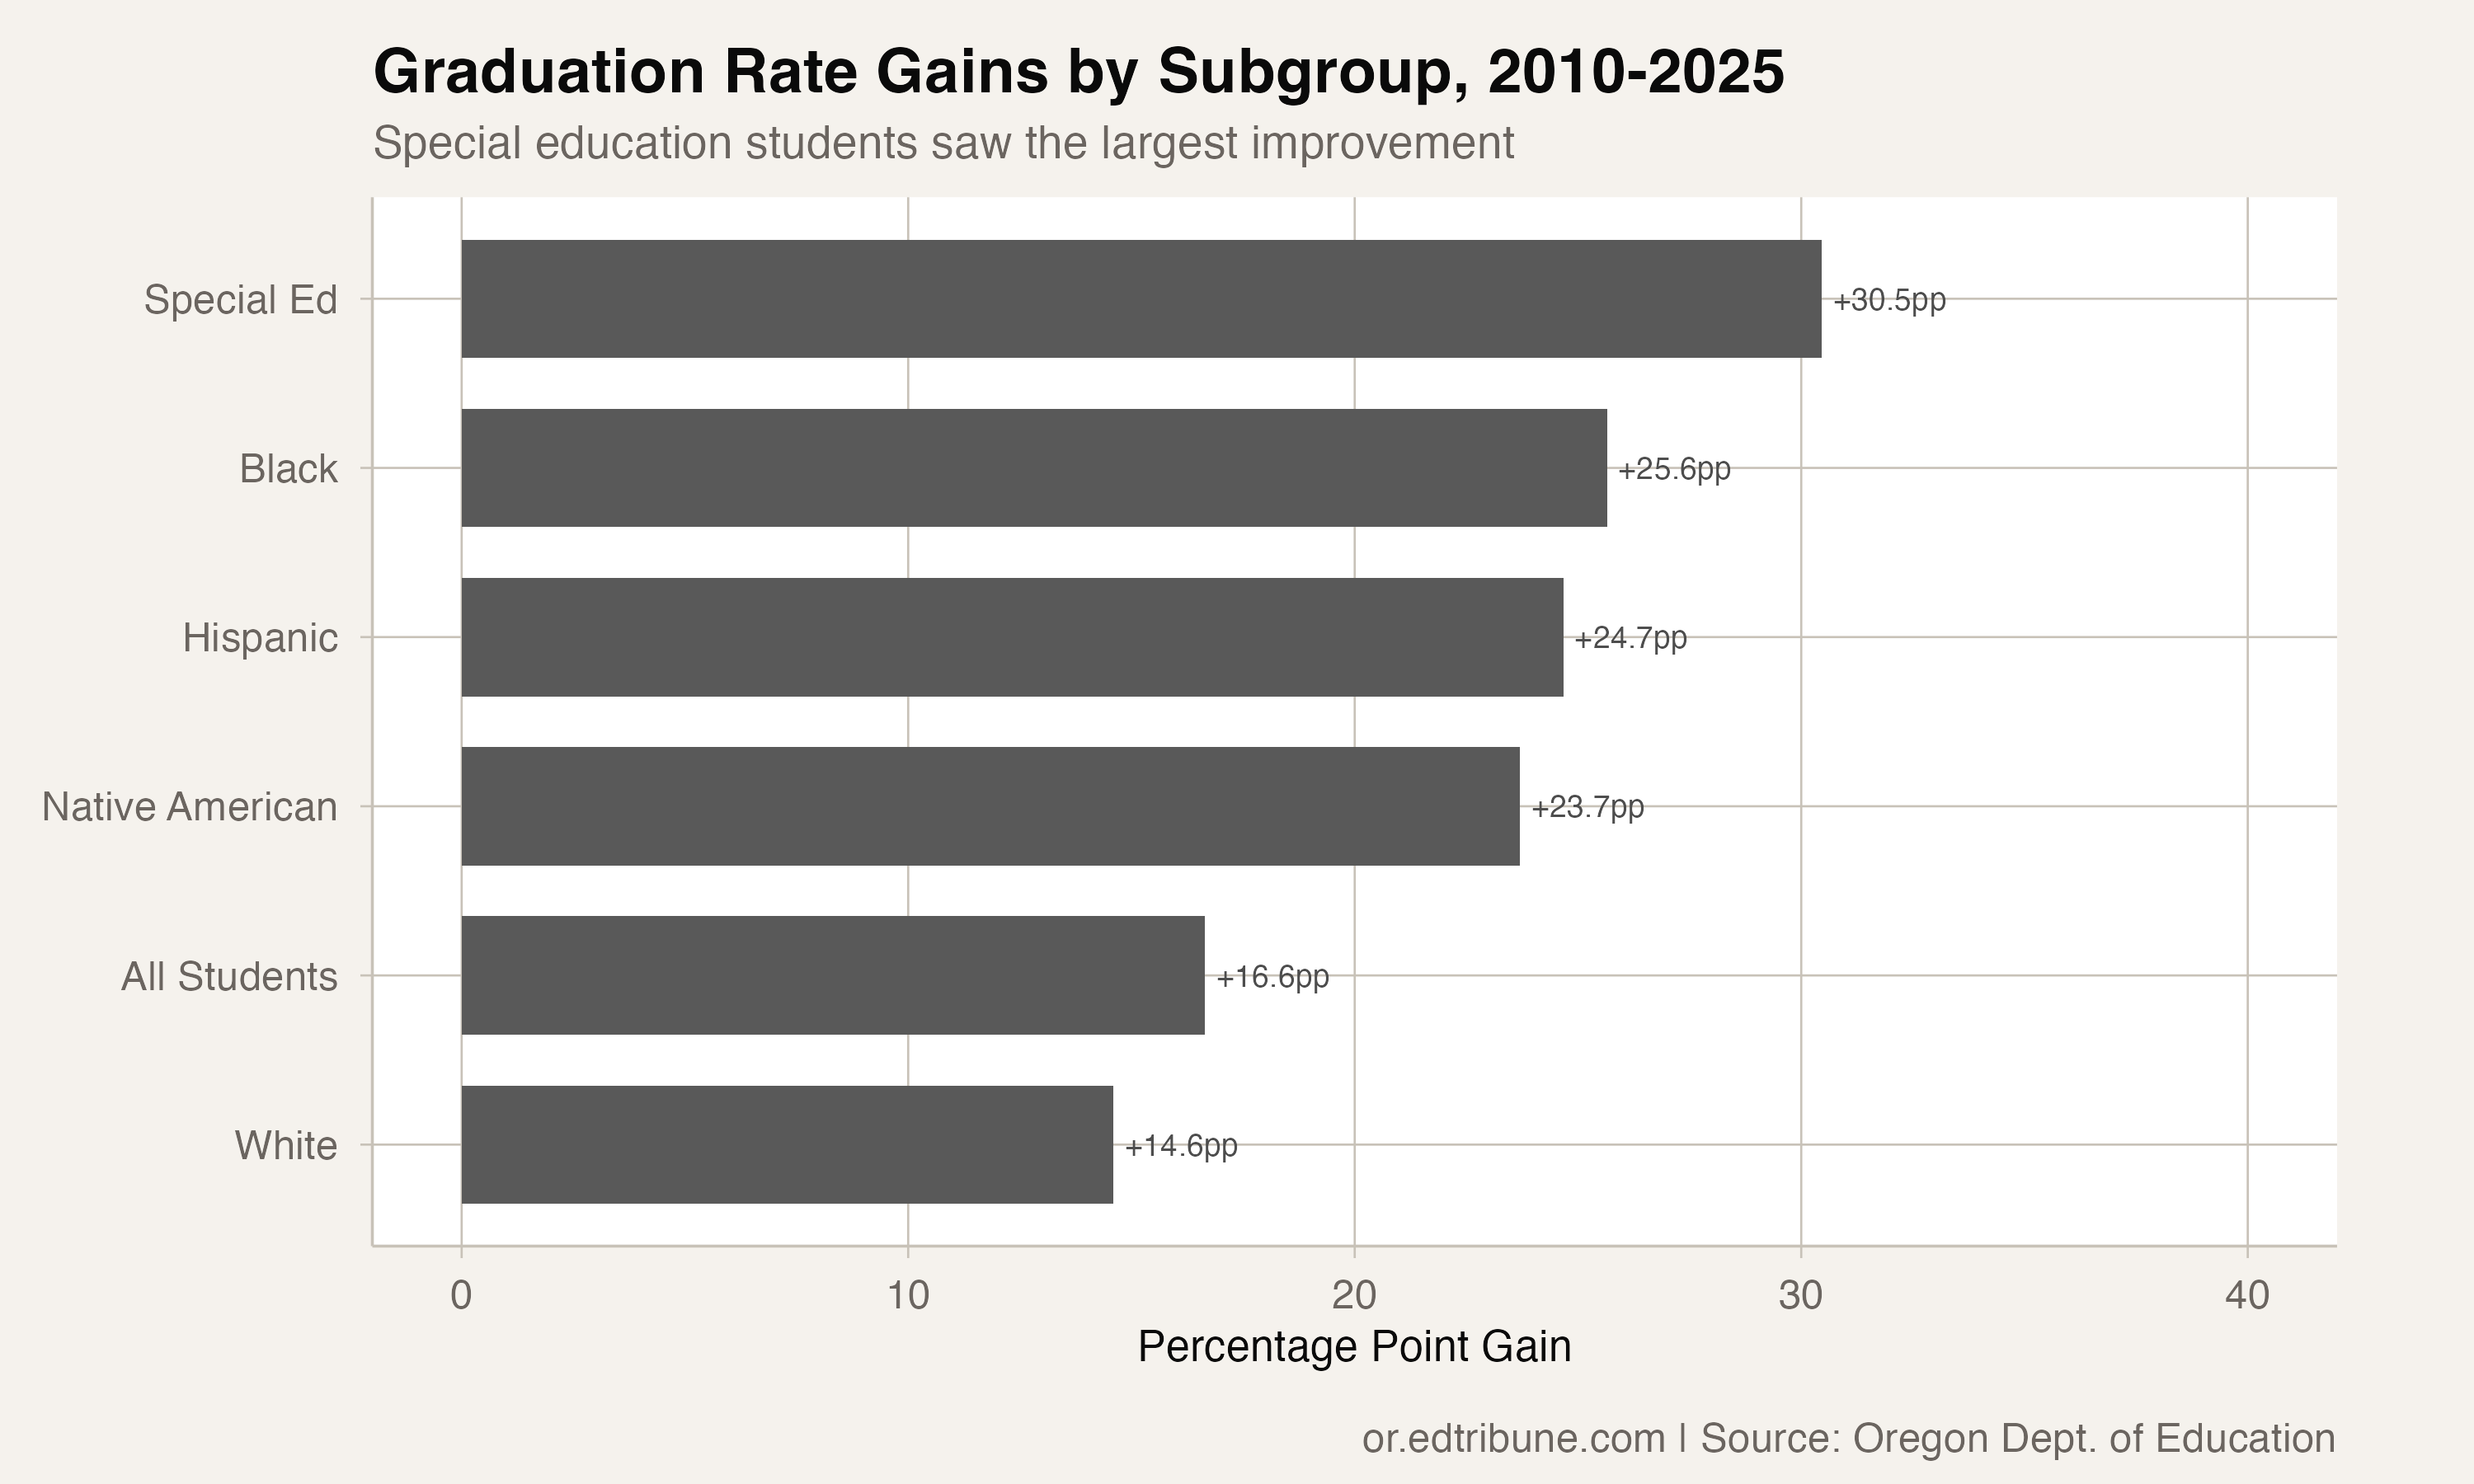
These gains narrowed but did not close the gaps. The white-Hispanic gap shrank from 14.7 points to 4.6 points. The white-Black gap fell from 20.1 to 9.1 points. The gap between special education students and the state average halved from 24.6 to 10.8 points.
An Asterisk Worth Reading
Oregon's improvement coincides with the suspension of the essential skills assessment requirement for graduation, which the state has extended through the 2027-28 school year. This means the Class of 2025's diploma did not require passing a standardized test in reading, writing, or math, a requirement that was in place during the earlier years of the data.
Whether the gains reflect genuine learning improvement, relaxed standards, or both is a question that won't be answered until Oregon reinstates its testing requirement. The state is essentially flying blind on proficiency while celebrating completion.
What Comes Next
At the current pace of roughly 1 to 1.5 points per year, Oregon would reach the national average of about 87% around 2028 or 2029. But the rate of improvement typically slows as it approaches higher levels. The last few percentage points are always the hardest, because they require reaching the most disconnected students.
The state's cohort is also growing. The 2025 graduating class of 48,563 is larger than any class since 2011, meaning Oregon must run faster just to maintain its rate.
Oregon's record 83% is real progress. It is also a reminder that one in six seniors still walks away without a diploma, and that the hardest work may be ahead.
Data Source
This analysis uses four-year adjusted cohort graduation rate data published by the Oregon Department of Education, covering the Classes of 2010 through 2025 (excluding 2013 and 2019-2022, years when comparable data was not published). Oregon's essential skills testing requirement has been suspended through 2027-28.
Detailed code that reproduces the analysis and figures in this article is available exclusively to EdTribune subscribers.
Discussion
Sign in to join the discussion.
Loading comments...