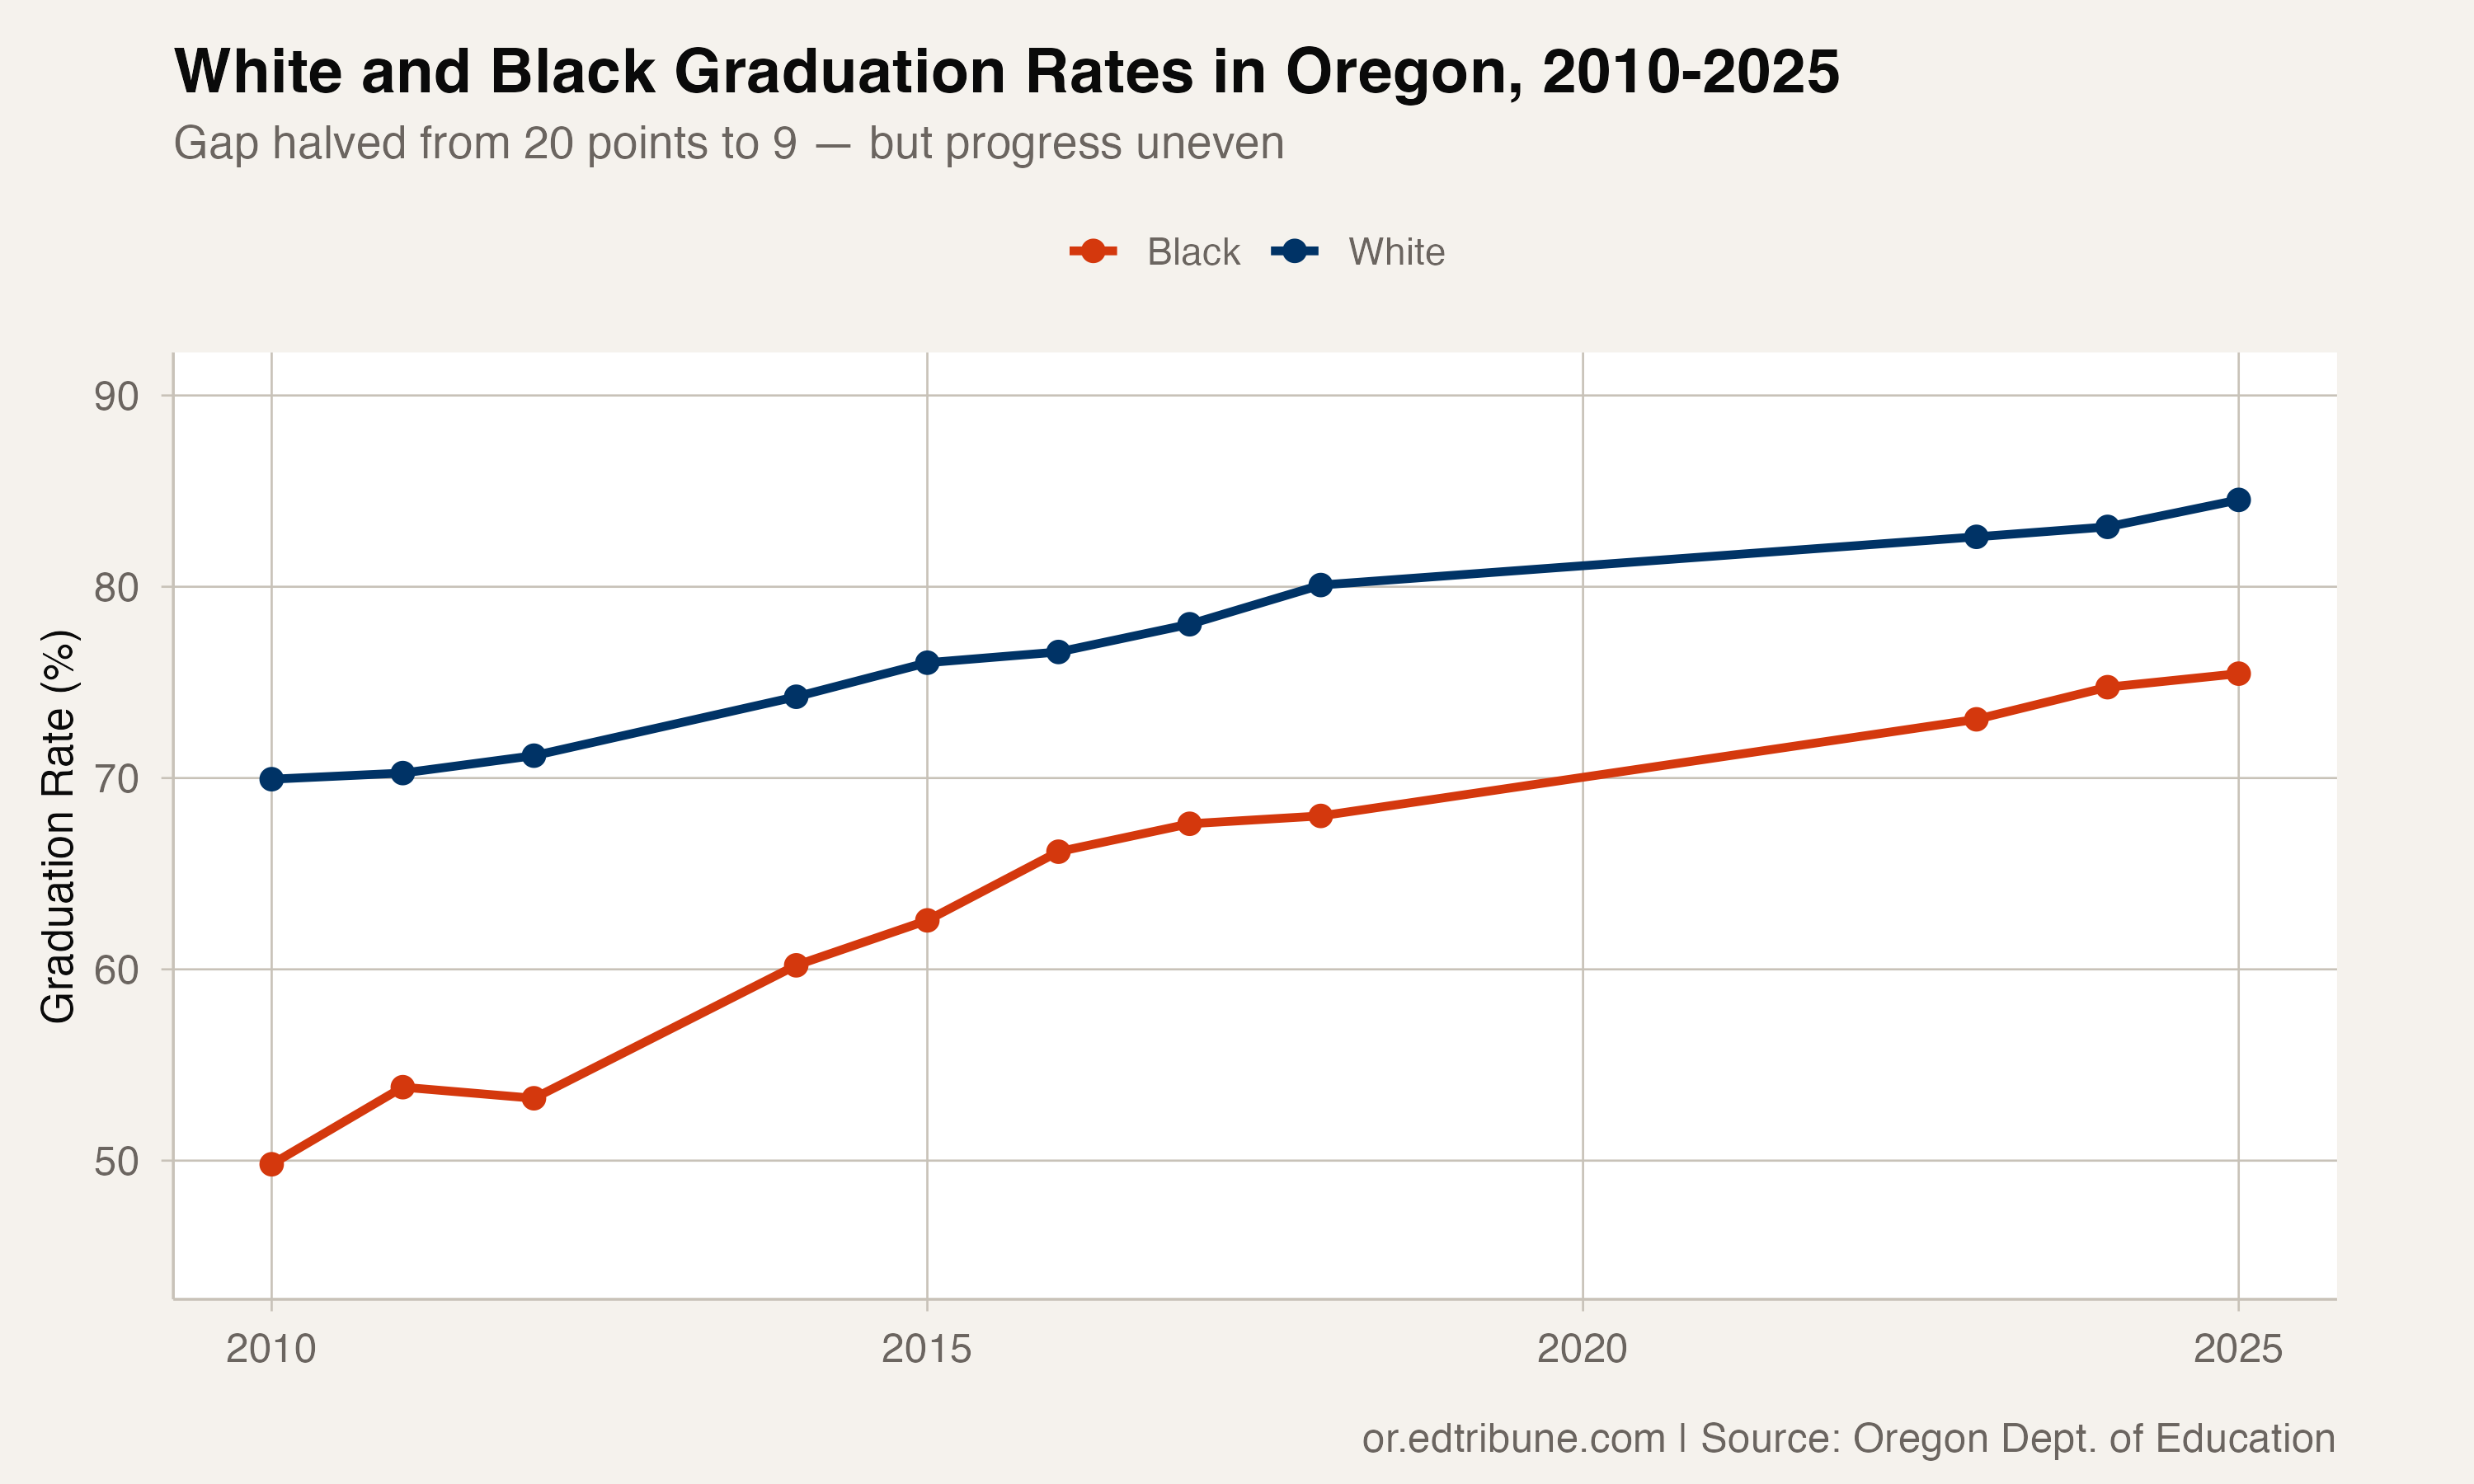
Oregon's white-Black graduation gap once spanned 20 percentage points. In 2010, white students graduated at 69.9% while Black students graduated at 49.8%. A Black student in Oregon was nearly twice as likely to not finish high school as a white peer.
By 2025, the gap has been cut roughly in half. Black students now graduate at 75.5%, white students at 84.5%, a gap of 9.1 points. The improvement was driven almost entirely by Black student gains: 25.6 percentage points versus 14.6 for white students.
The Progress Is Real
Black student graduation rates have improved in every single year of available data. The trajectory runs from 49.8% in 2010 through 68.0% in 2018, then continued through the COVID gap to reach 73.1% in 2023, 74.8% in 2024, and 75.5% in 2025.
| Year | Black | White | Gap |
|---|---|---|---|
| 2010 | 49.8% | 69.9% | 20.1 |
| 2014 | 60.2% | 74.2% | 14.0 |
| 2018 | 68.0% | 80.1% | 12.1 |
| 2023 | 73.1% | 82.6% | 9.5 |
| 2024 | 74.8% | 83.1% | 8.4 |
| 2025 | 75.5% | 84.5% | 9.1 |
Three in four Black students in the Class of 2025 graduated on time, a rate better than Oregon's overall rate was in 2015. That comparison deserves emphasis: the 2025 Black student graduation rate exceeds where the entire state was a decade earlier.
The Slight Widening
The gap hit its narrowest point of 8.4 points in 2024, then widened to 9.1 in 2025. This could be noise. The Black graduating cohort of 1,202 students is large enough for meaningful analysis but small enough that year-to-year fluctuations are expected.
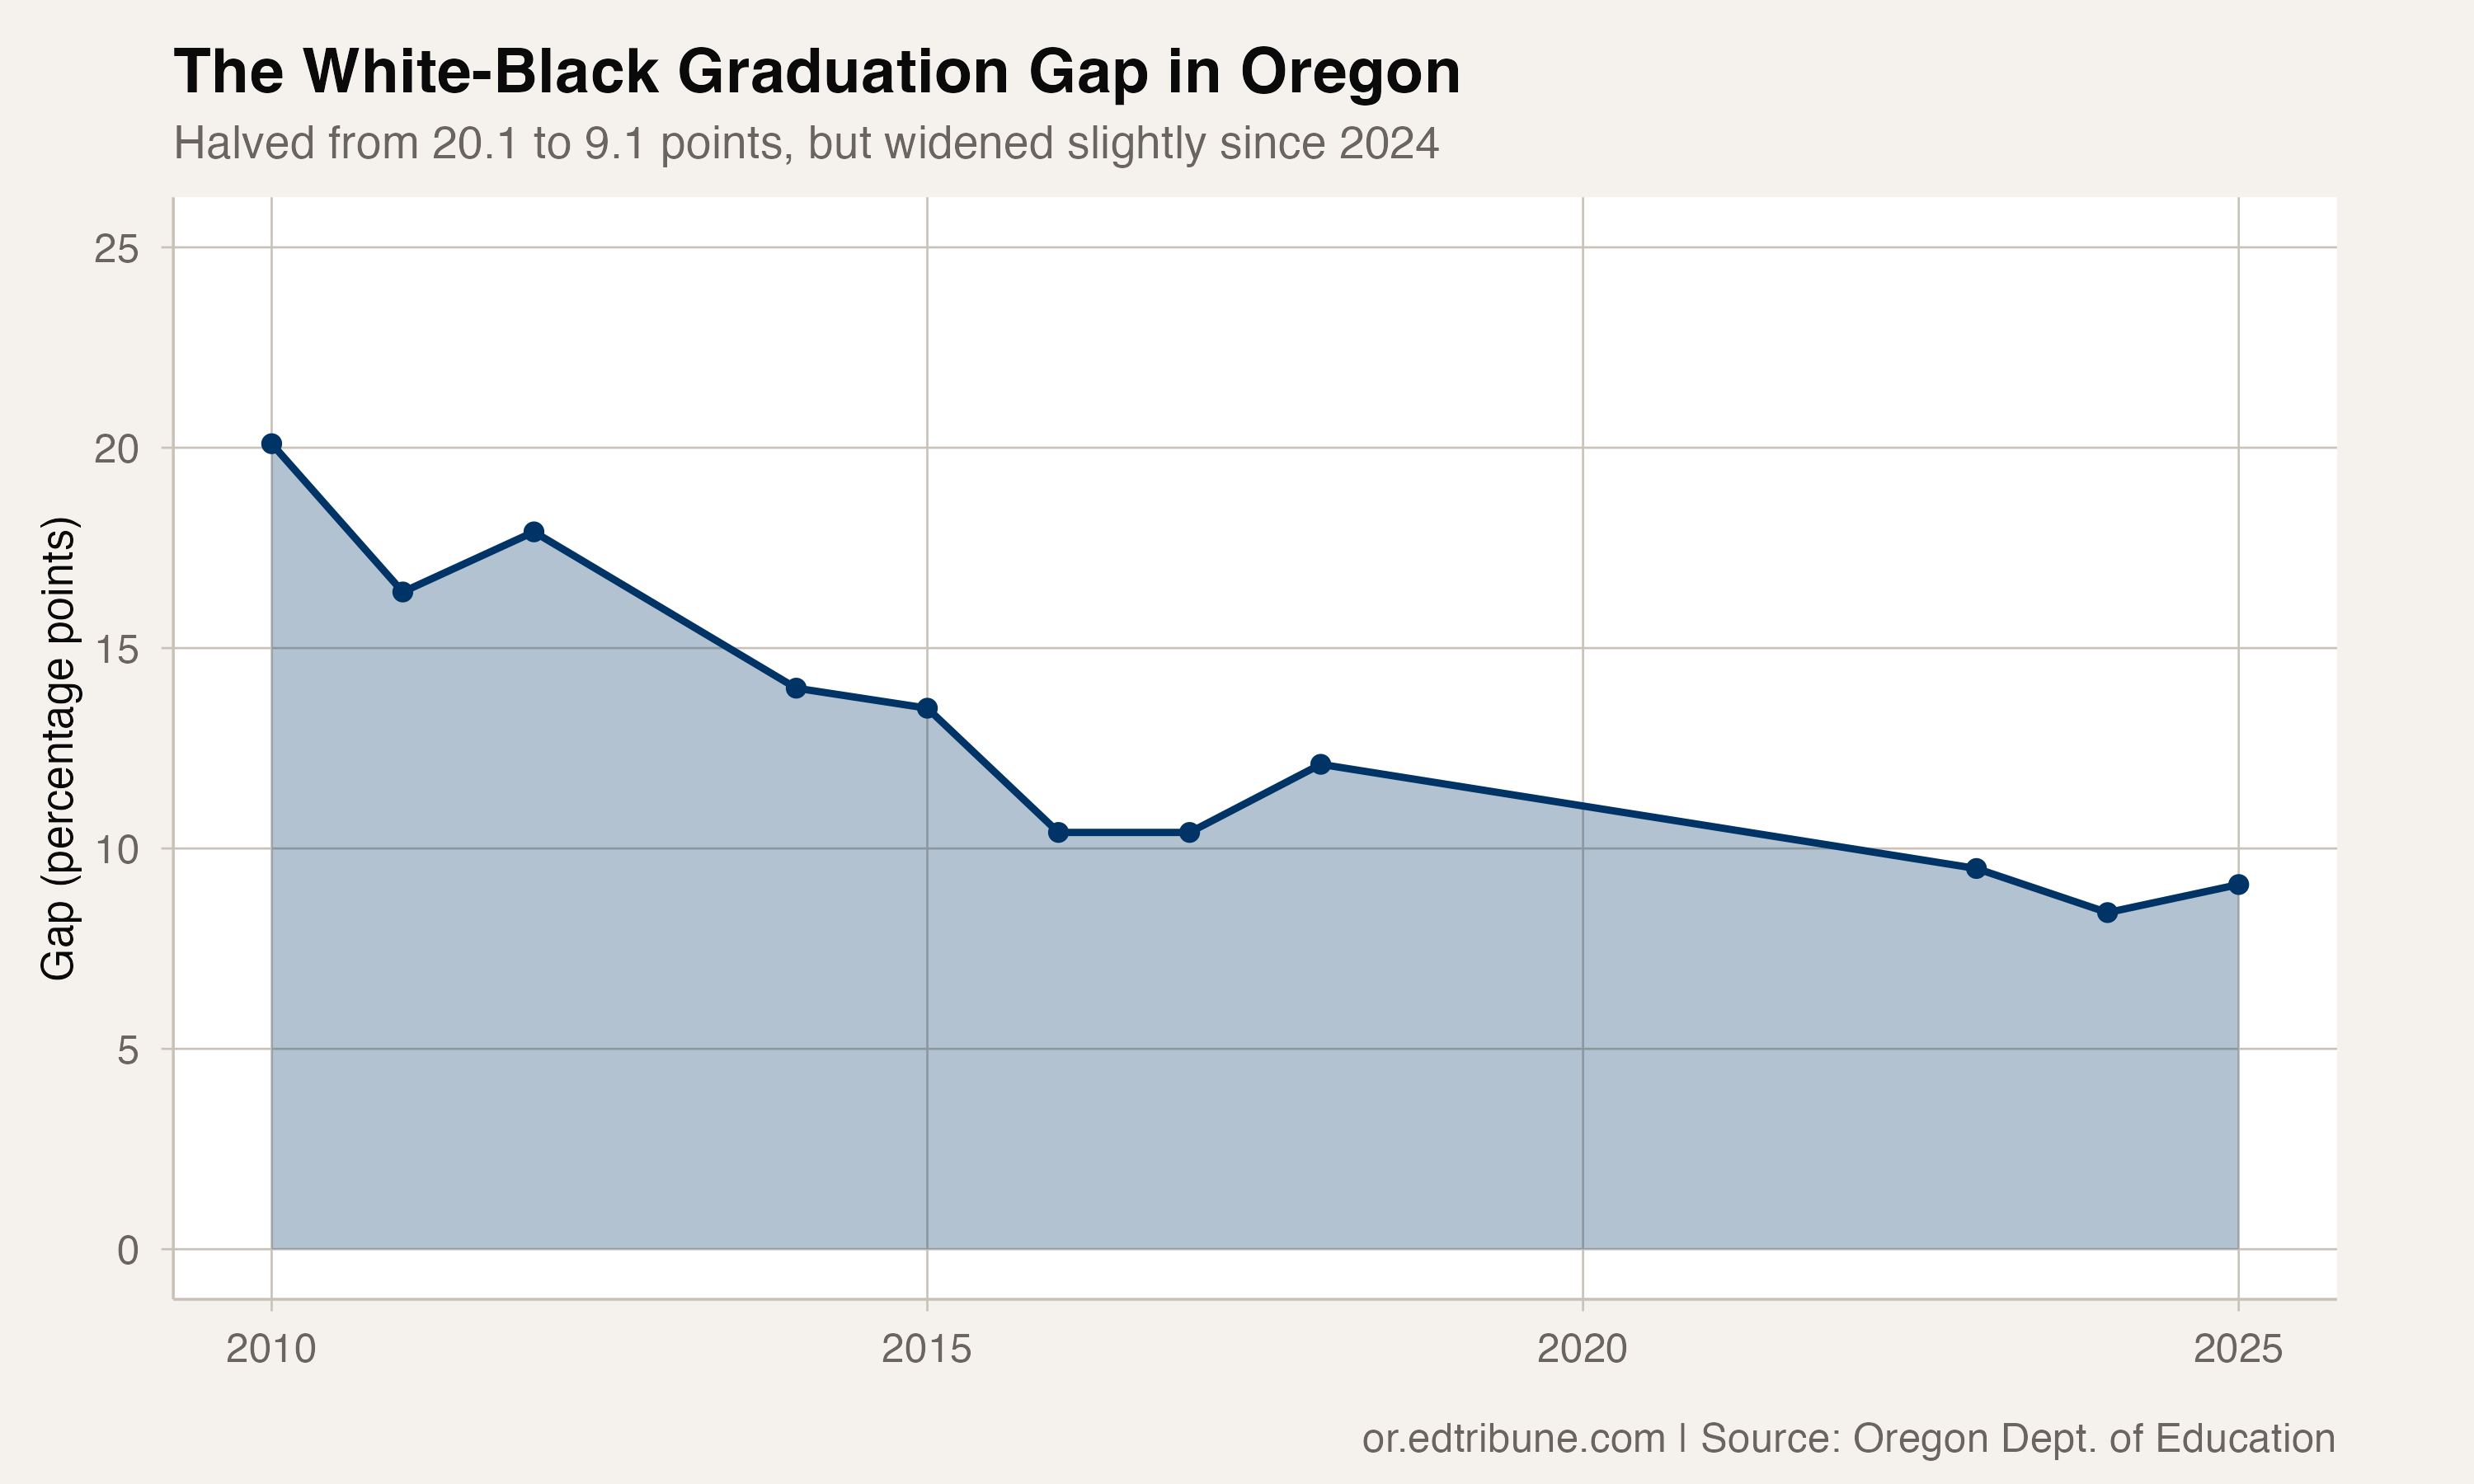
Worth watching is the trajectory of the widening. White students gained 1.4 points from 2024 to 2025; Black students gained 0.7 points. If that differential persists, the gap could start opening rather than closing. But a single year does not make a trend, and the Black student rate is still at an all-time high.
A Small Population With Large Stakes
Oregon's Black student population is small relative to many states. The 2025 graduating cohort included 1,202 Black students, about 2.5% of all graduates. More than a quarter of those students (341) attended Portland Public Schools, where Black students graduated at 71.8%.
The small statewide population means that a few dozen students shifting between graduation and non-completion can move the percentage noticeably. It also means that the supports and interventions that matter most for Black students in Oregon are concentrated in a handful of districts, primarily in the Portland metro area.
What 9.1 Points Still Means
Cutting a gap in half is progress. But 9.1 points is not a rounding error. It means that for every 100 Black students who enter ninth grade, roughly 9 fewer will graduate on time compared to their white peers. In a cohort of 1,202, that gap represents about 109 students.
At the current pace of improvement, the gap would close in roughly a decade. But gaps tend to narrow quickly at first and slowly at the end, as the remaining non-completers face increasingly entrenched barriers (housing instability, criminal justice involvement, untreated mental health conditions) that schools alone cannot solve.
Oregon has halved its white-Black graduation gap. Finishing the job will require the same sustained investment that produced the first 11 points of progress.
Data Source
This analysis uses four-year adjusted cohort graduation rate data published by the Oregon Department of Education, covering the Classes of 2010 through 2025 (excluding 2013 and 2019-2022, years when comparable data was not published).
Detailed code that reproduces the analysis and figures in this article is available exclusively to EdTribune subscribers.
Discussion
Sign in to join the discussion.
Loading comments...