In this series: Oregon Chronic Absenteeism.
Correction (September 5, 2026): An earlier version of this article reported that Nyssa cut its chronic absenteeism rate from 33% to 10.6%, and that 16 of 178 Oregon districts with comparable data had recovered to their pre-COVID rates. Both figures came from Oregon's district-level rows. A district row counts every student the district serves, including students in district-sponsored online programs, while the state publishes no attendance figures at all for many of those programs' own school rows, so a district rate can move because the mix of students behind it moved rather than because attendance changed. Nyssa opened Nyssa Virtual School in 2022-23, and by 2024-25 that school accounted for half the students in the district row. On the schools Oregon publishes attendance for, Nyssa's 2024-25 rate is 18.3%, not 10.6%, and 14 of the same 178 districts have recovered, not 16. A sentence estimating lost student-days and a quotation attributed to the governor without a source have been removed, and the pre-pandemic drift, given earlier as about 0.75 percentage points a year, is the regression's 0.8. Every other statewide figure below is unchanged.
Oregon's chronic absenteeism rate peaked in the wrong year. Most states hit their worst attendance numbers in 2021-22, the first full year back from pandemic disruptions. Oregon peaked in 2022-23, at 38.1%, a year later than the national pattern. Whatever forces kept students out of school during the pandemic did not loosen their grip in Oregon until a year after they did elsewhere.
Two years later, the rate stands at 33.5%. One in three students, approximately 174,000 children, missed at least a tenth of the school year in 2024-25.
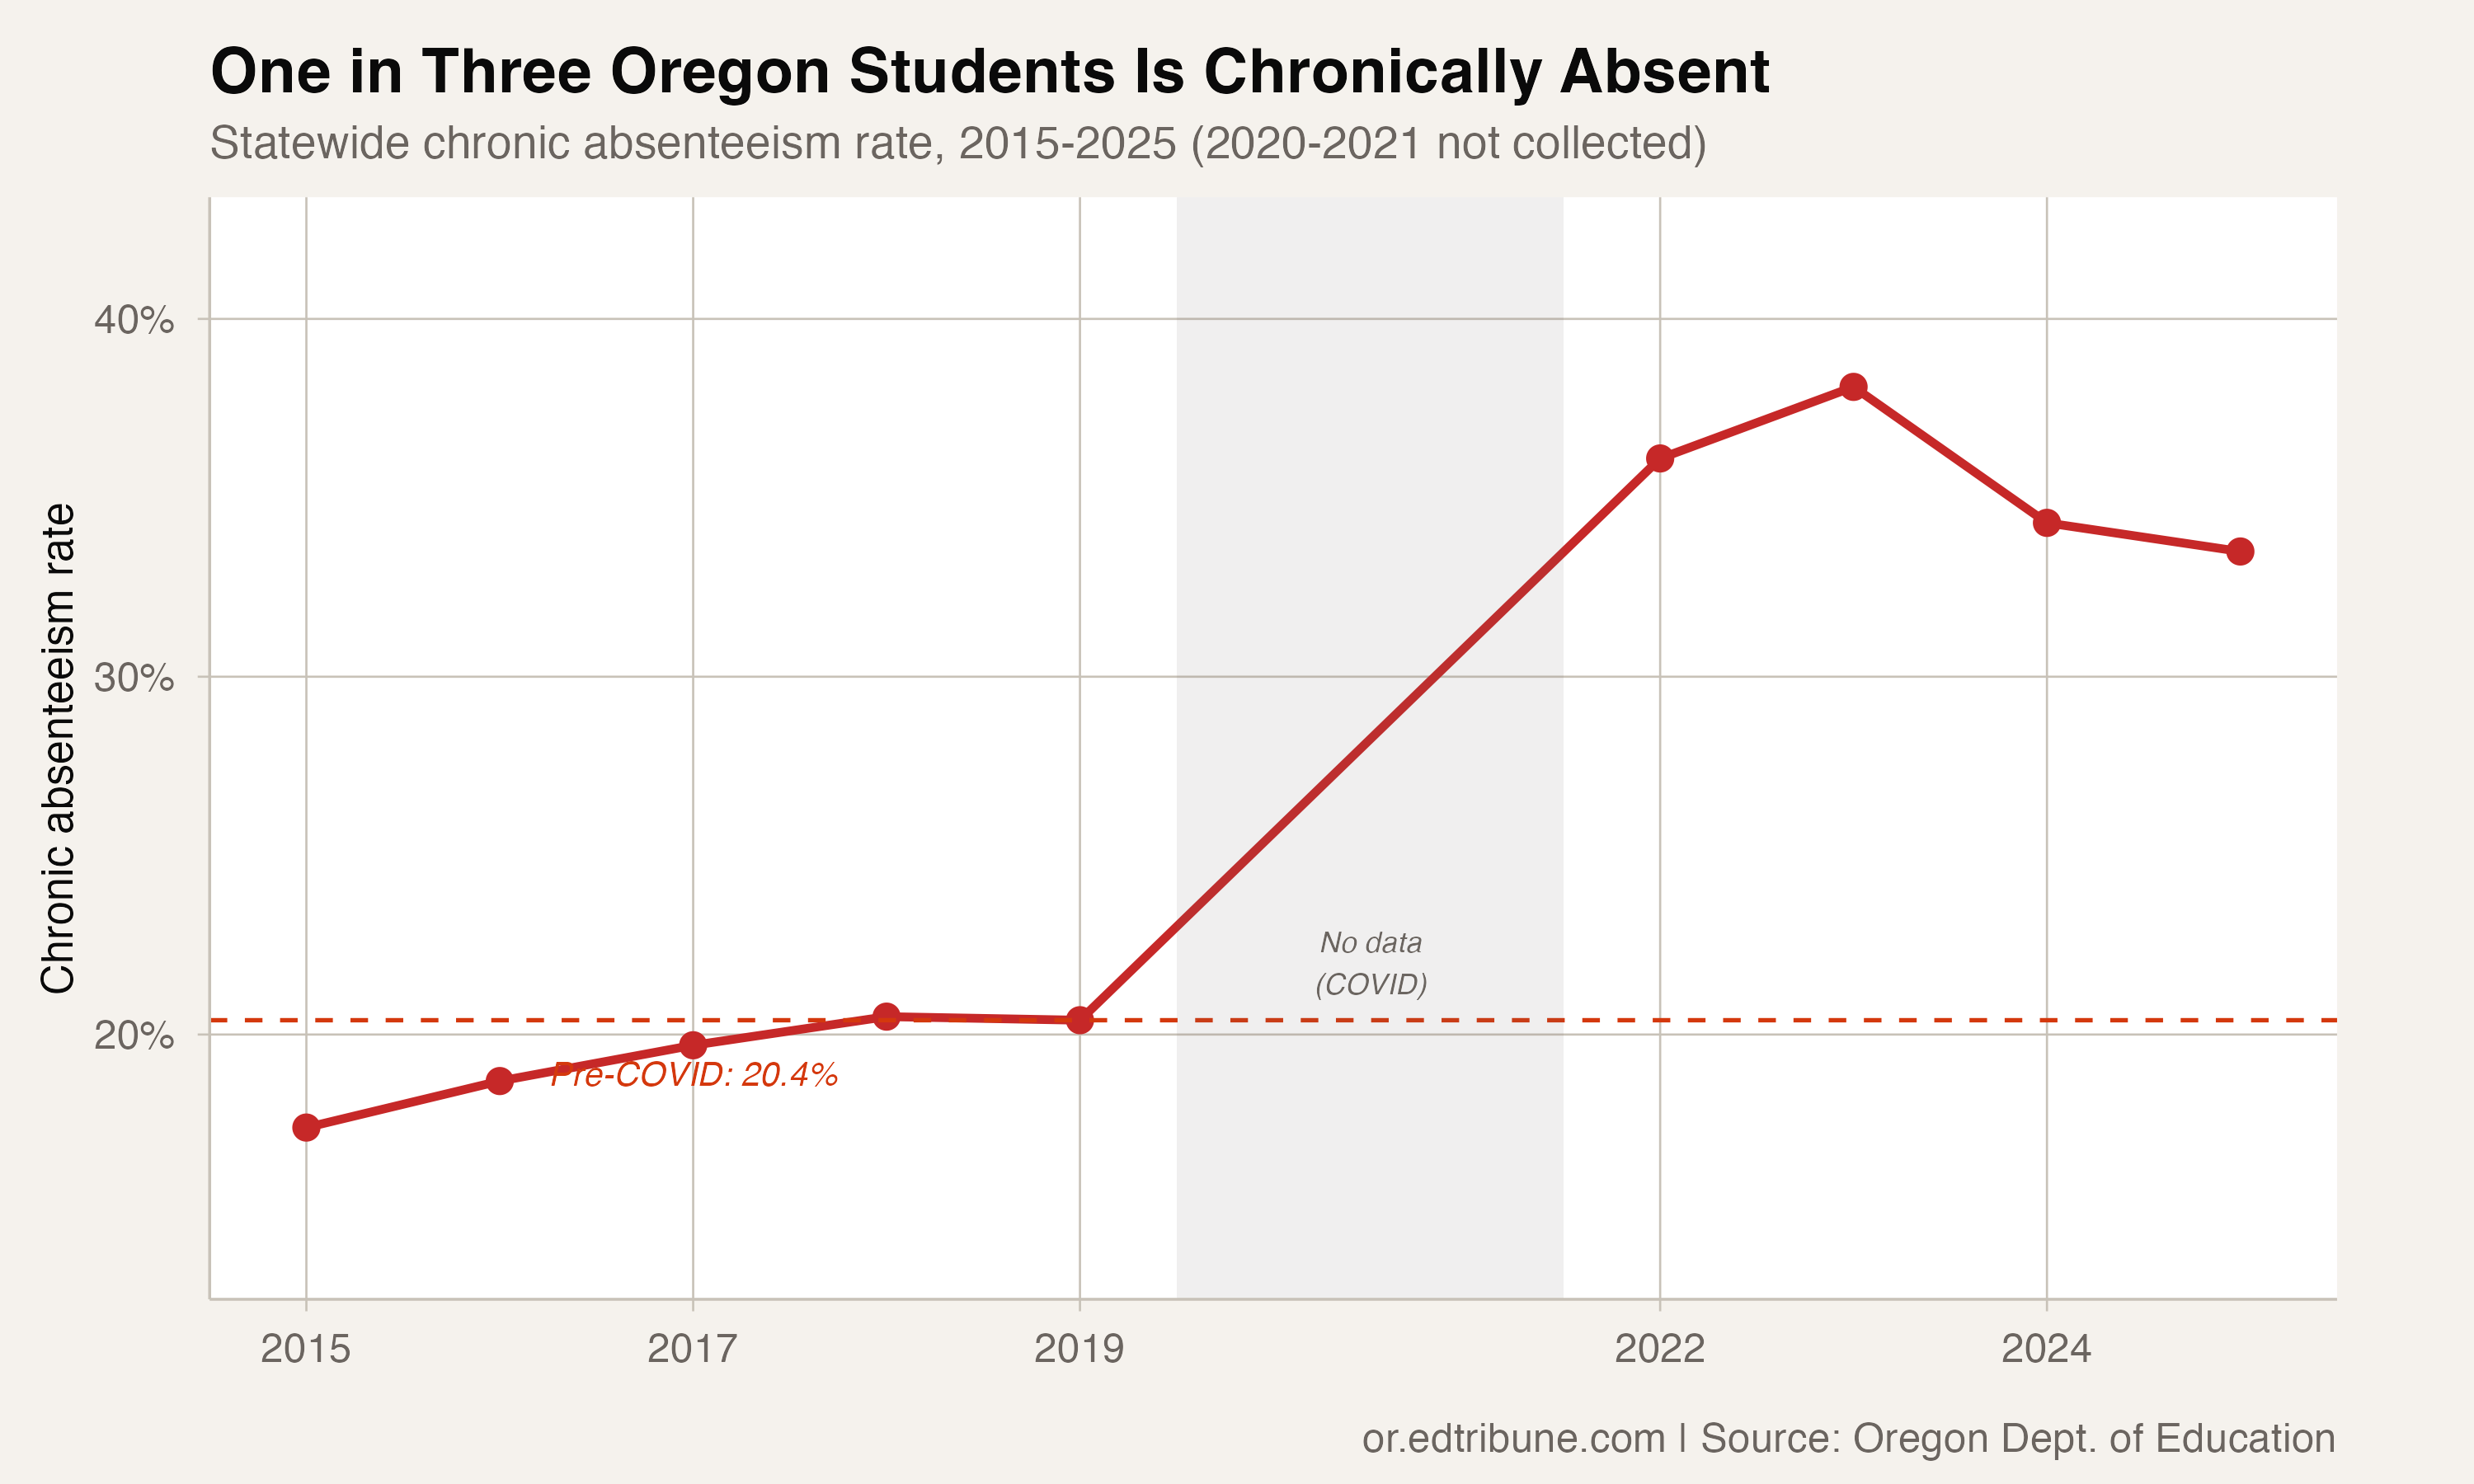
That 33.5% is a substantial drop from the 38.1% peak. It is also 13 percentage points above the 20.4% rate Oregon posted in 2018-19, the last normal year. The state has recovered 26% of the ground lost since the pandemic. Seventy-four percent remains.
The pace problem
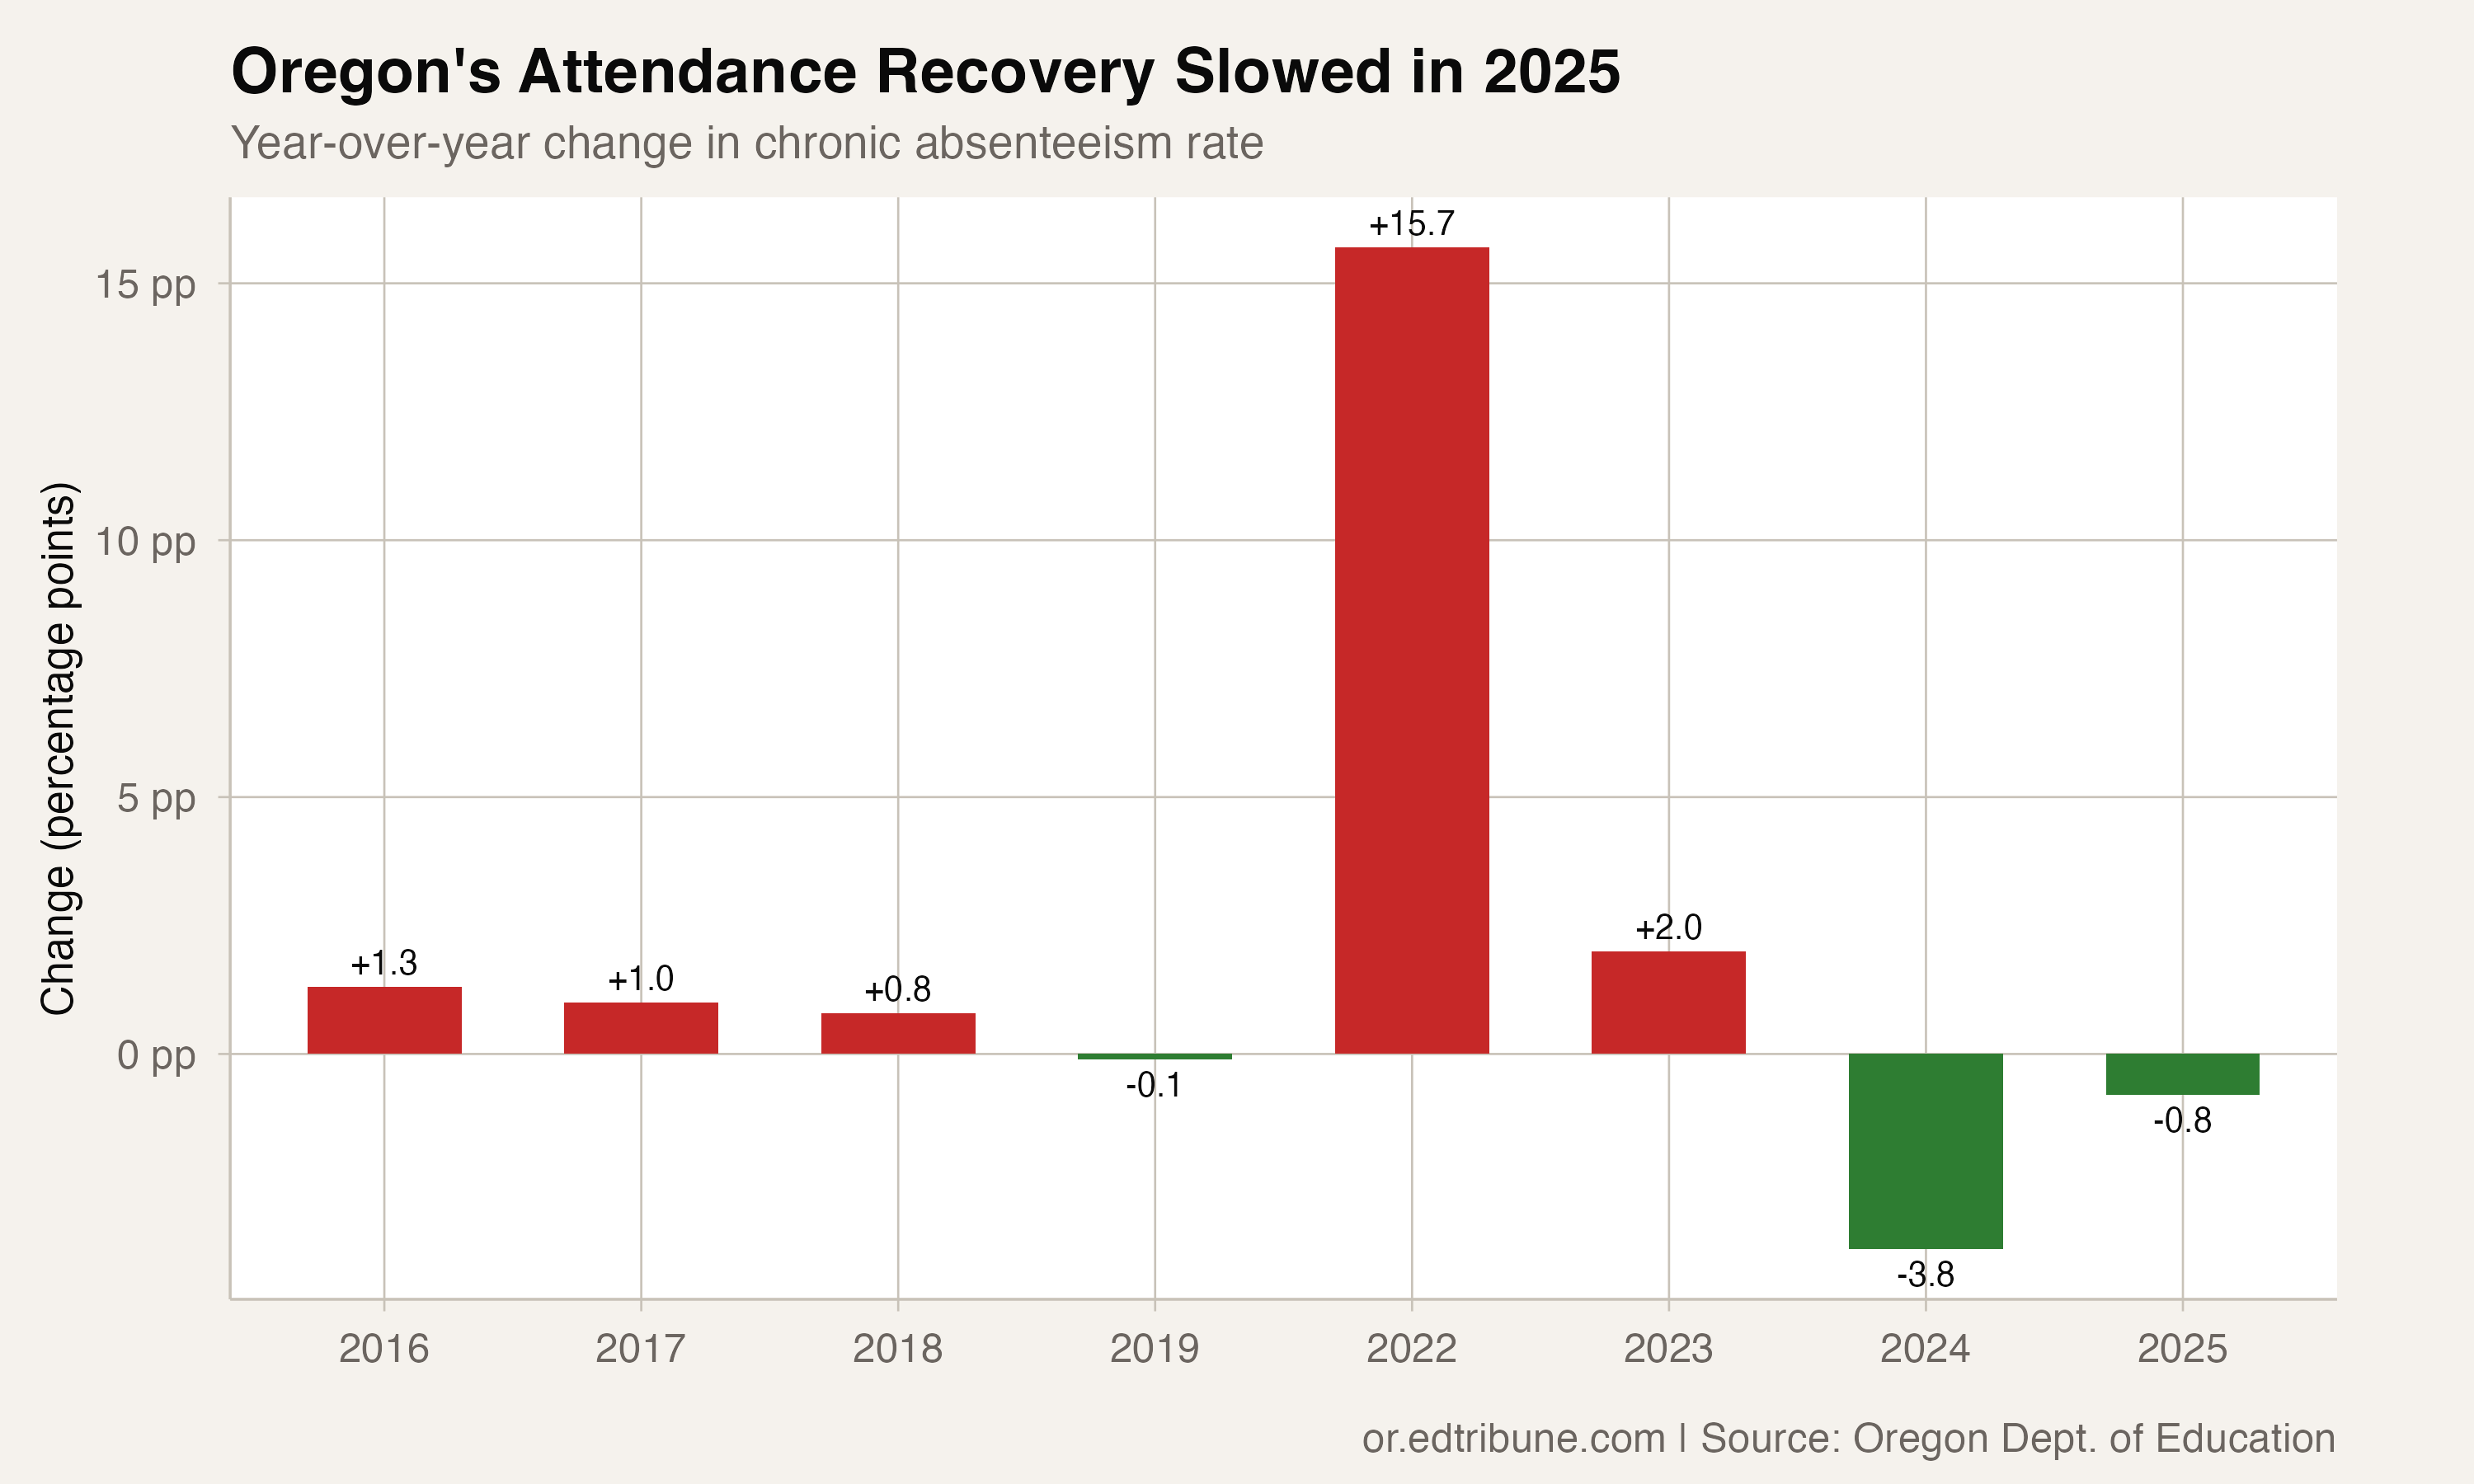
The two-year improvement, 38.1% to 34.3% to 33.5%, tells an initially encouraging story. But the pace is slowing. The first year gained 3.8 percentage points. The second gained 0.8.
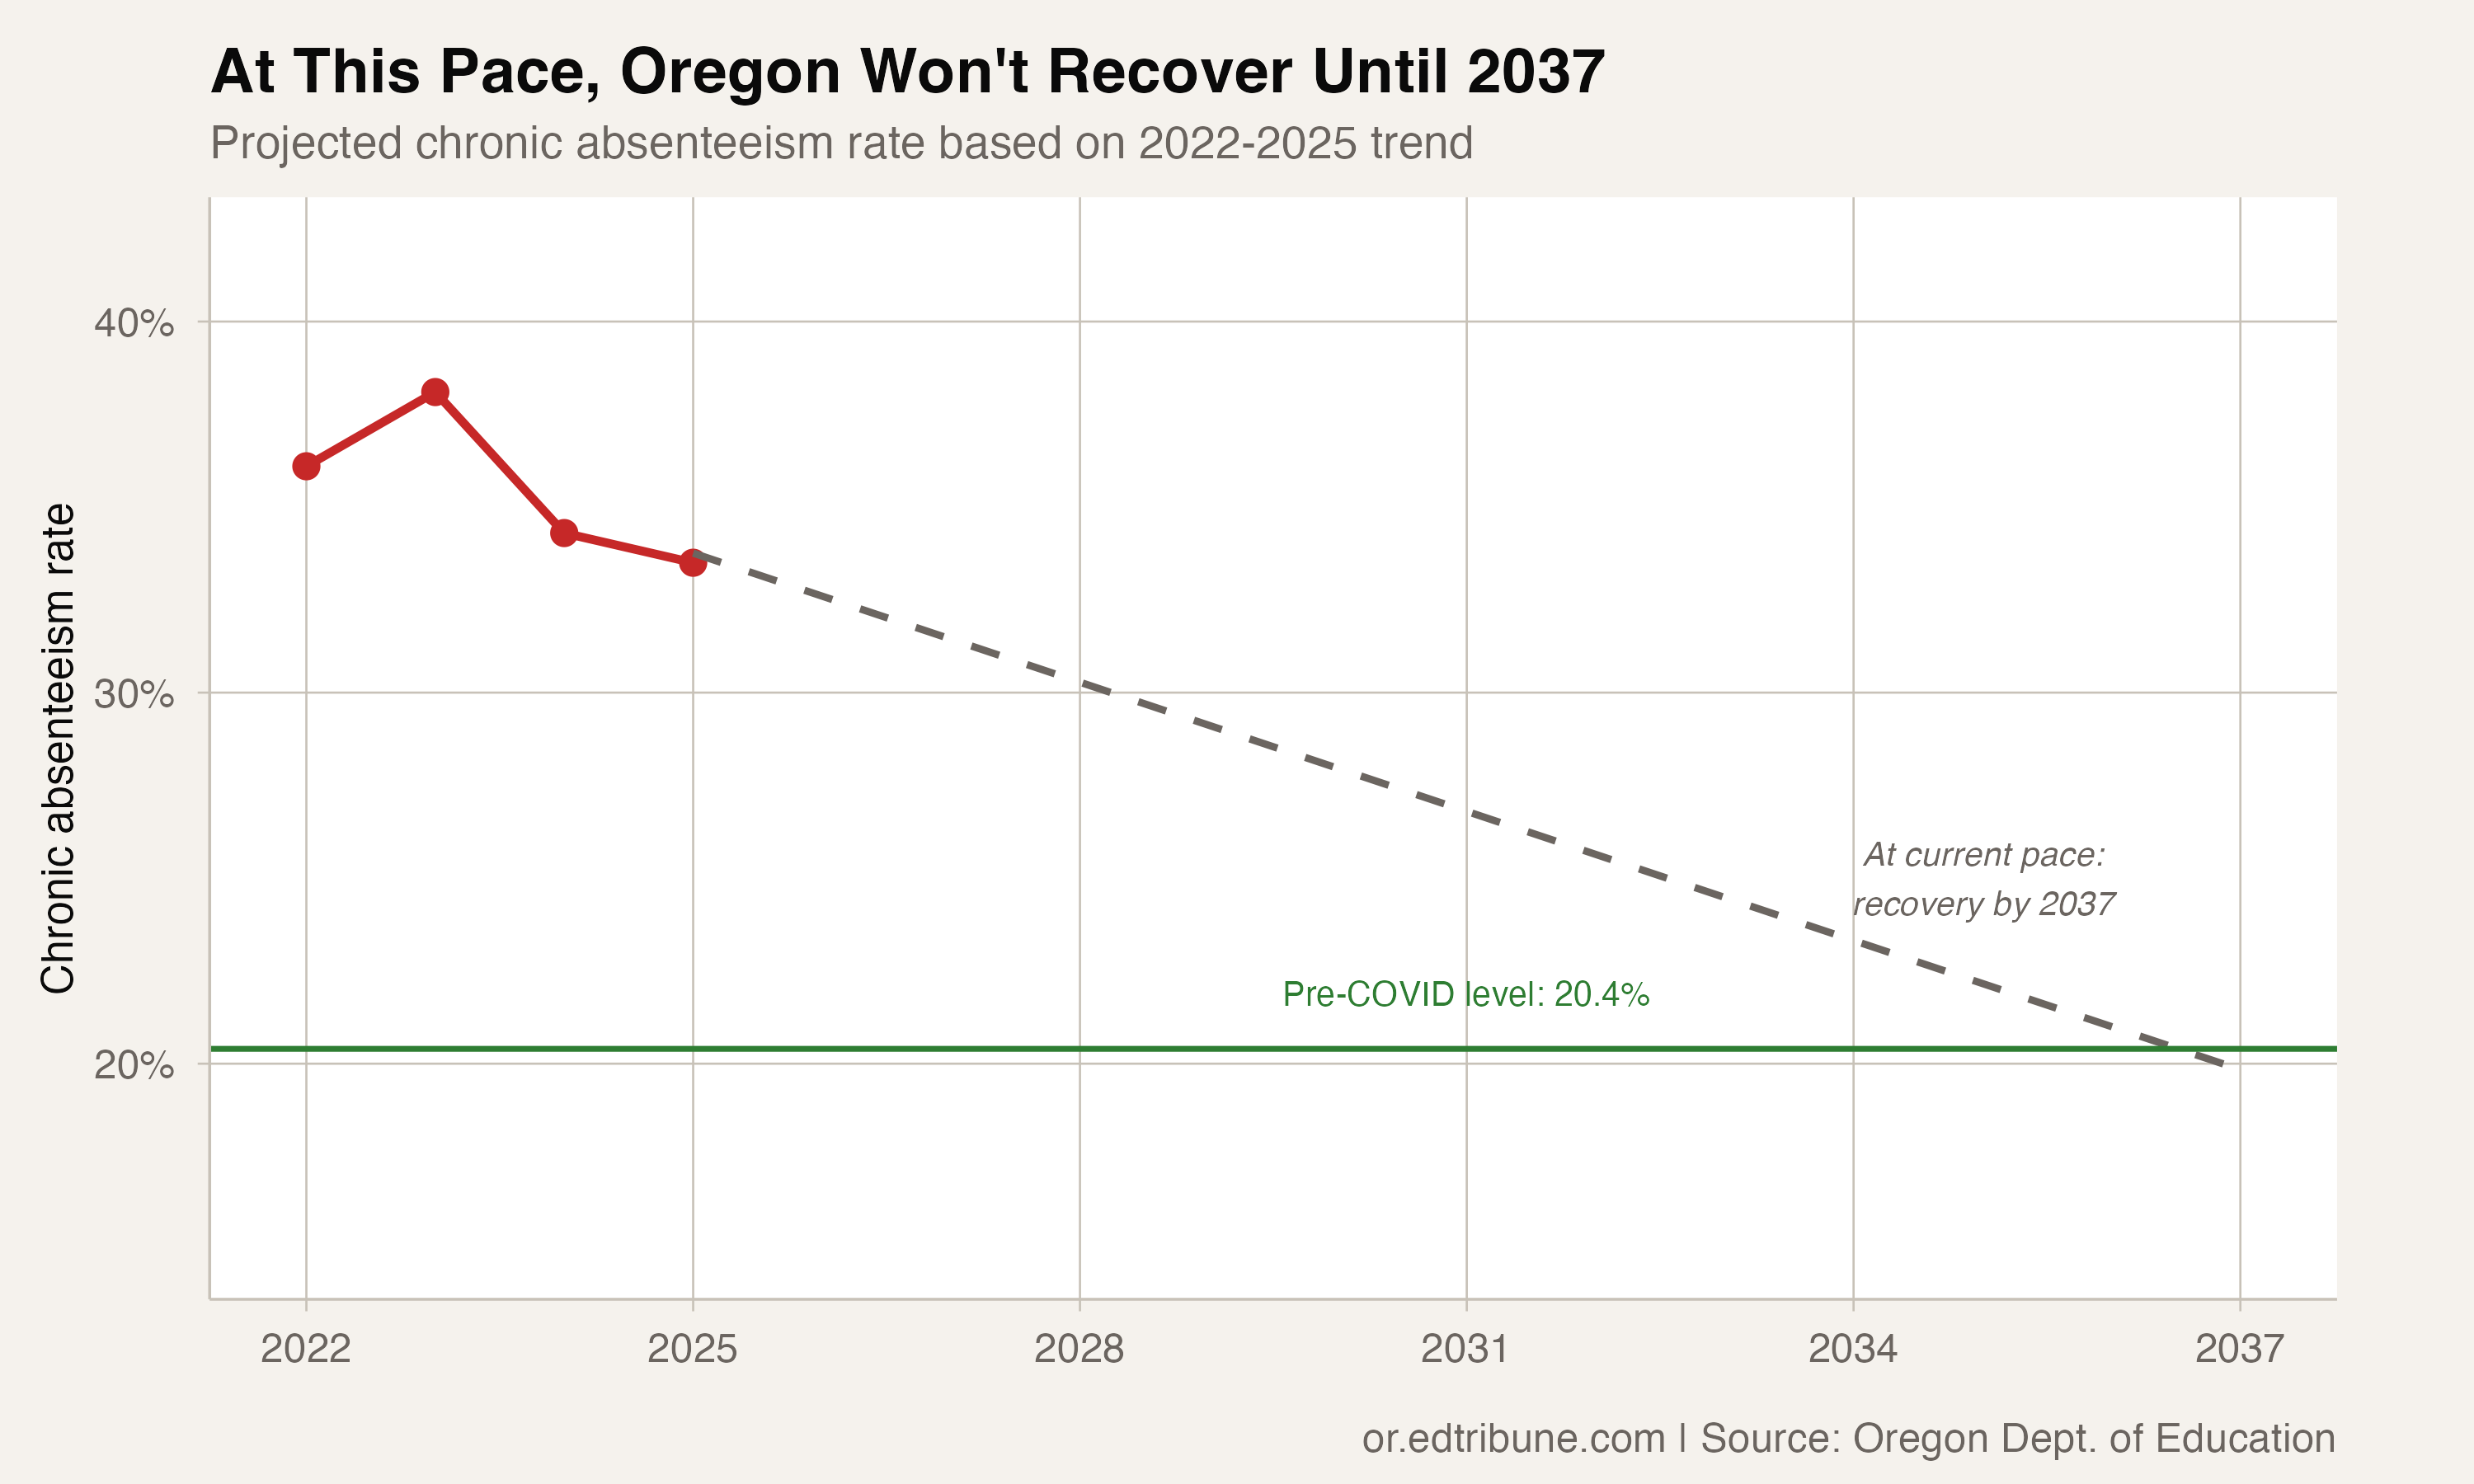
A linear regression through the post-COVID data points gives a rate of improvement of 1.16 percentage points per year. At that pace, Oregon returns to its pre-pandemic 20.4% in 2037, more than a decade from now. That projection assumes the pace holds steady, which the deceleration from 3.8 to 0.8 suggests it may not.
The projection is not a prediction. It is an arithmetic statement about what happens if nothing changes. If the 2025-26 numbers show another year of improvement below one point, 2037 starts looking optimistic.
Before COVID, Oregon was already sliding
The statewide rate was not stable before the pandemic. It rose steadily from 17.4% in 2014-15 to 20.5% in 2017-18, ticked down to 20.4% in 2018-19, and then the floor dropped out. The pre-pandemic trend was already upward: chronic absenteeism was growing at about 0.8 percentage points per year even before COVID.
That pre-existing drift matters for the recovery target. Returning to 20.4% does not mean returning to a healthy baseline. It means returning to a rate that was itself worsening. Oregon's chronic absenteeism challenge did not start in March 2020. The pandemic converted a slow-moving problem into a crisis.
What 33.5% means in practice
At 33.5%, the average Oregon school has one-third of its students meeting the definition of chronic absence.
Oregon counts a student as chronically absent after missing 10% or more of enrolled school days, excused absences included.
Oregon enrolled 520,023 students in the 2024-25 attendance file.
A FutureEd analysis placed Oregon among the bottom tier of states recovering from COVID-era absenteeism.
Oregon did not collect chronic absenteeism data during the 2019-20 and 2020-21 school years. The two-year gap in the data means the pandemic's full trajectory, how quickly rates rose and whether they peaked during remote learning or after, is invisible. What the data shows is the before and the after, with a chasm in between.
The landscape underneath
The statewide 33.5% obscures enormous variation. Only 14 of 178 districts with comparable data, 8%, have recovered to their pre-COVID rates on the schools Oregon publishes attendance for. Nearly half of Oregon's Native American students are chronically absent. Homeless students are at 56%. Twelfth-graders are at 52.5%, with zero improvement since 2022.
Sixteen districts got worse in every measurable year from 2016 through 2023, a six-year streak of unbroken deterioration spanning both sides of the pandemic. At the other end, Nyssa, a small farming community in eastern Oregon, cut the rate across its three in-person schools from 33.1% to 18.3%.
Why these counts use school rows
Oregon publishes a chronic absenteeism rate for each district and a separate rate for each school. The district rate counts every student the district serves, including students enrolled in district-sponsored online programs, but the state suppresses the attendance figures for many of those programs' own school rows. When an online program opens or grows inside a district, the district rate moves because the composition of the population behind it moved, not because any student's attendance changed.
Nyssa is the clearest case in the state. Its district row reads 10.6% in 2024-25, but that row counts 2,185 students, and 1,095 of them sit in schools whose attendance figures Oregon does not publish, almost all of them in Nyssa Virtual School. Across the three Nyssa schools the state does publish, the rate is 18.3%. Comparing 33.1% in 2021-22 to 10.6% in 2024-25 is comparing two different populations.
Both district comparisons in this article are therefore made on the schools Oregon publishes attendance for, at both endpoints. That is the change behind the recovered count of 14. The district rows on their own produce 16.
The articles that follow in this series examine each of these patterns. What they share is a common starting point: Oregon's chronic absenteeism rate is 33.5%, it is improving slowly, and it is nowhere close to where it was.
Analysis uses statewide, district and school chronic absenteeism data published by the Oregon Department of Education.
Detailed code that reproduces the analysis and figures in this article is available exclusively to EdTribune subscribers.
Discussion
Sign in to join the discussion.
Loading comments...