Correction (2026-05-21): Salem-Keizer is Oregon's third-largest district (not second-largest). Hispanic enrollment share corrected to 47.9% (was 48.1%), Hispanic student count to 17,232 (was 17,335), Hispanic chronically absent count to 8,323 (was 8,373), white enrollment share to 37.7% (was 35.7%). Comparison with next-worst large district updated to reflect Gresham-Barlow at 40.3% (2.8-point gap, not 10 points).
In this series: Oregon Chronic Absenteeism.
In October 2024, Governor Tina Kotek picked up the phone and personally called families in the Salem-Keizer↗ET school district to talk about attendance. The governor of Oregon, dialing numbers, asking parents to send their kids to school.
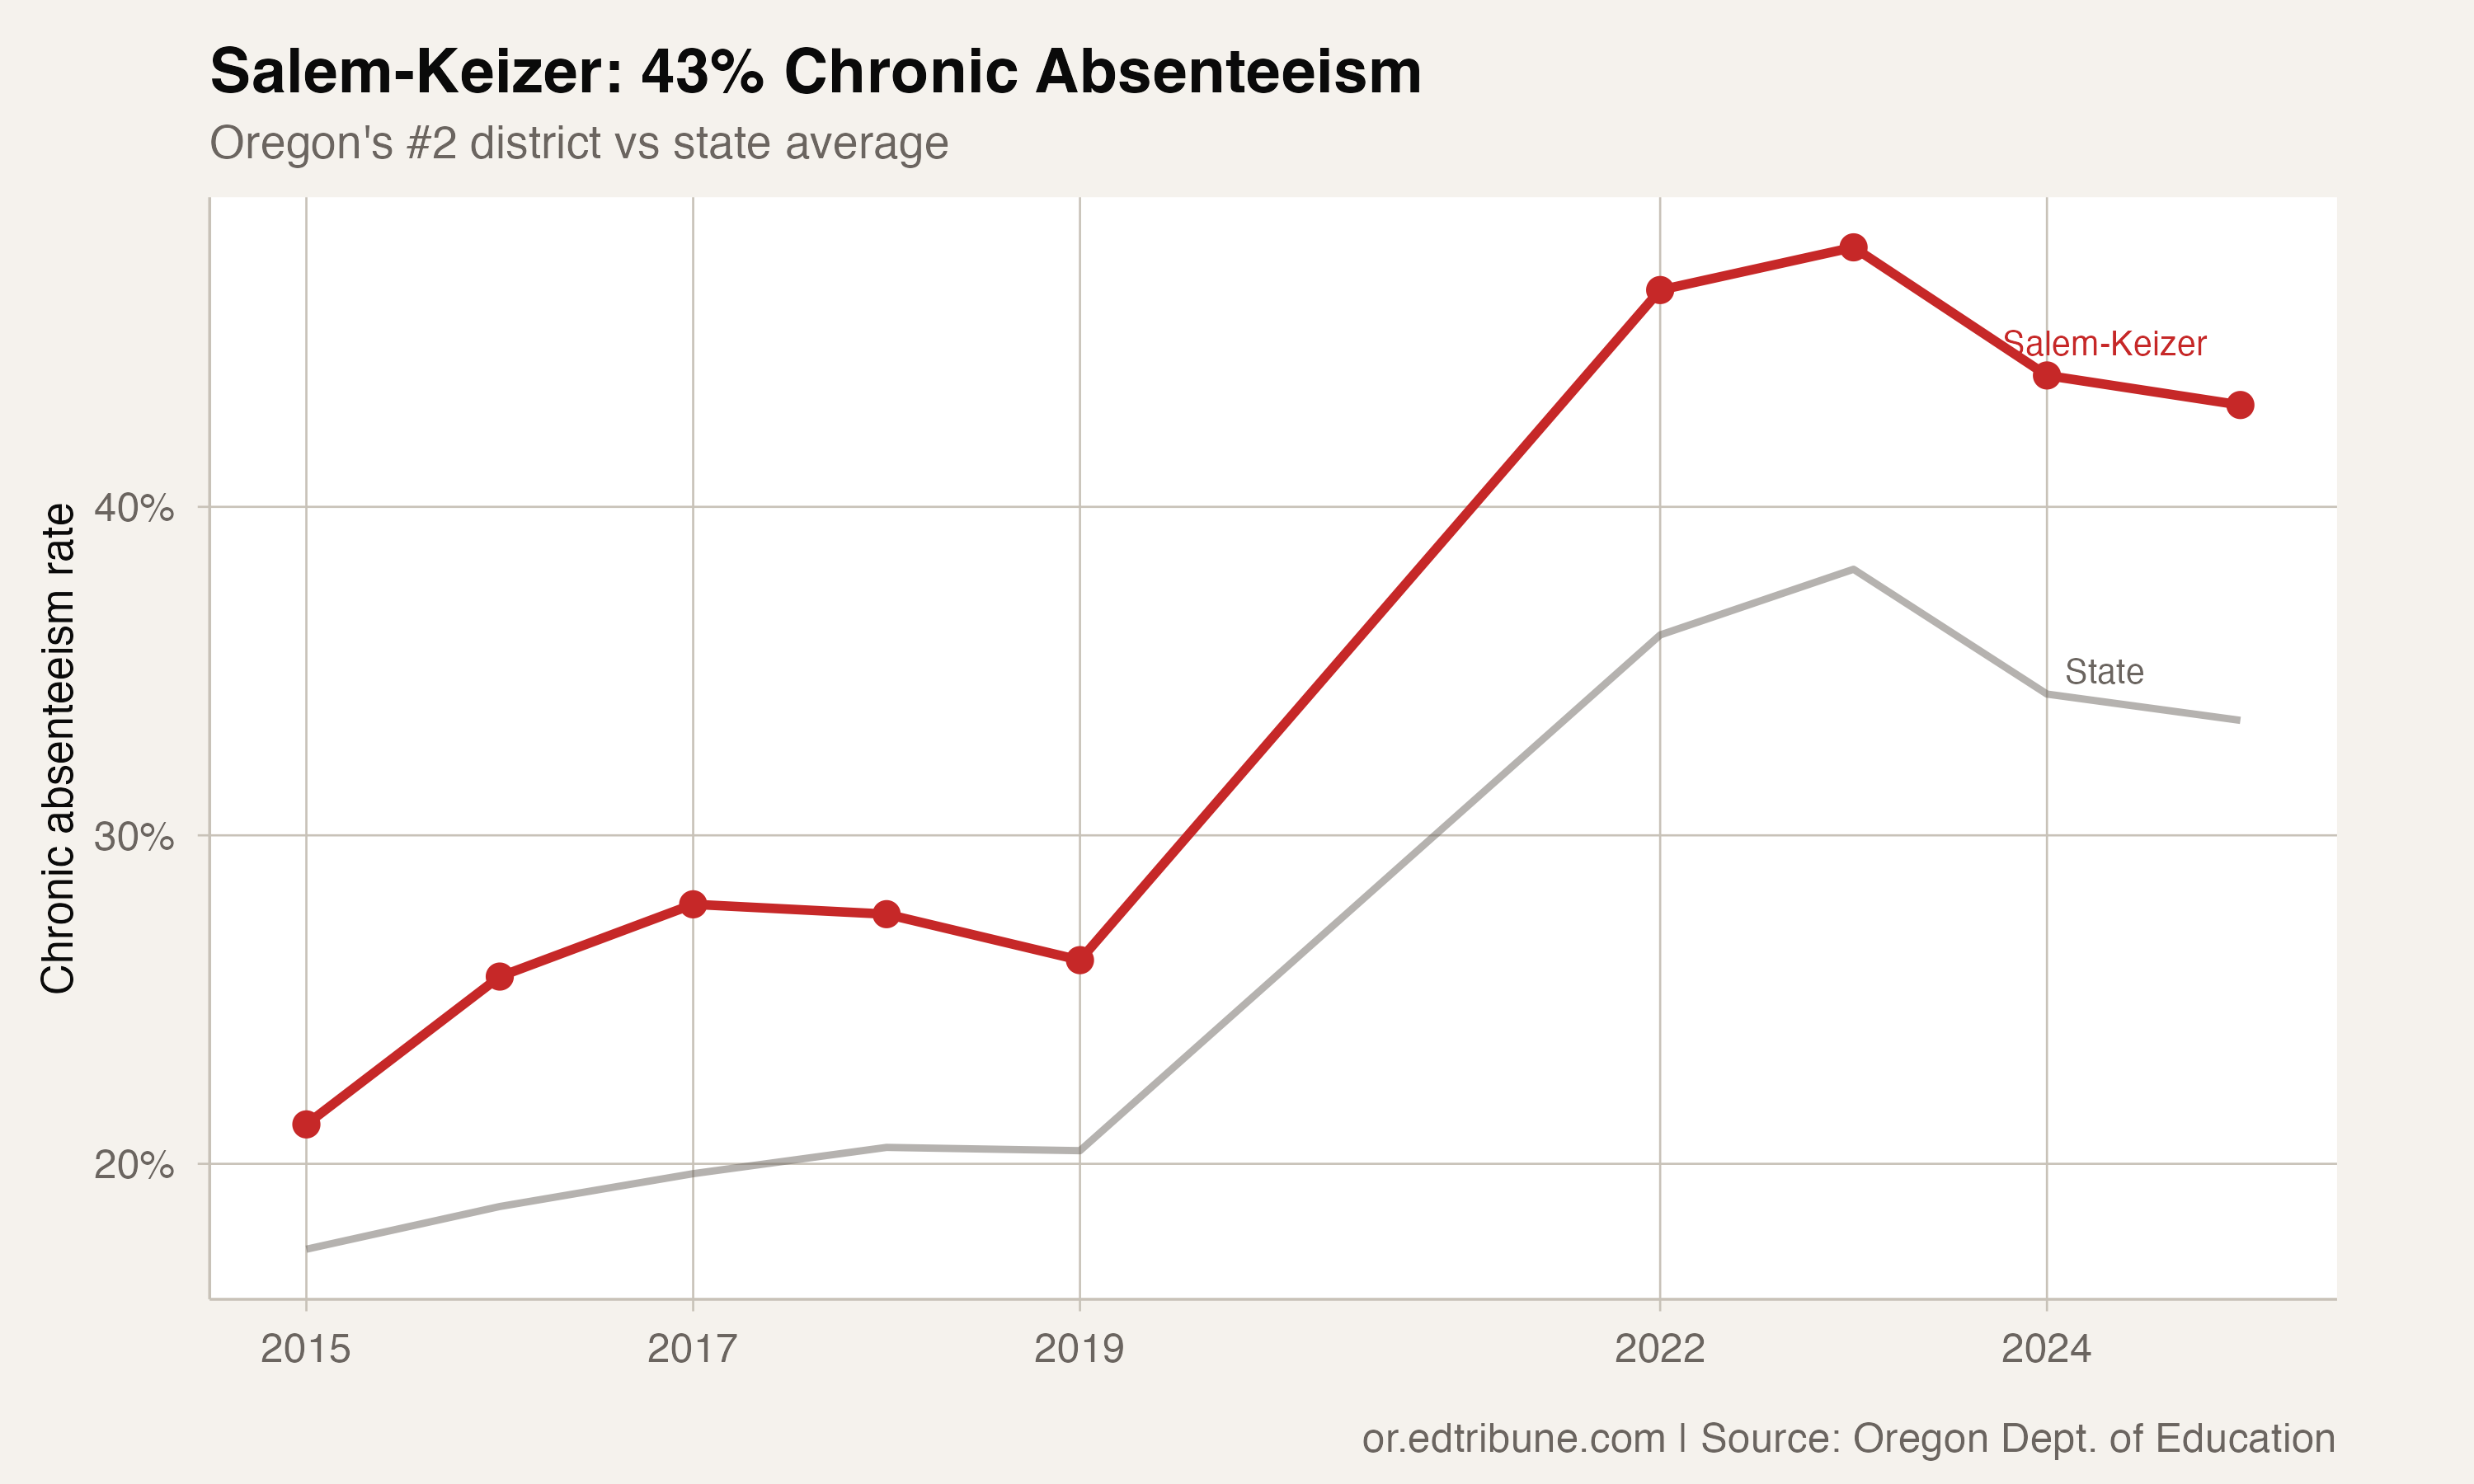
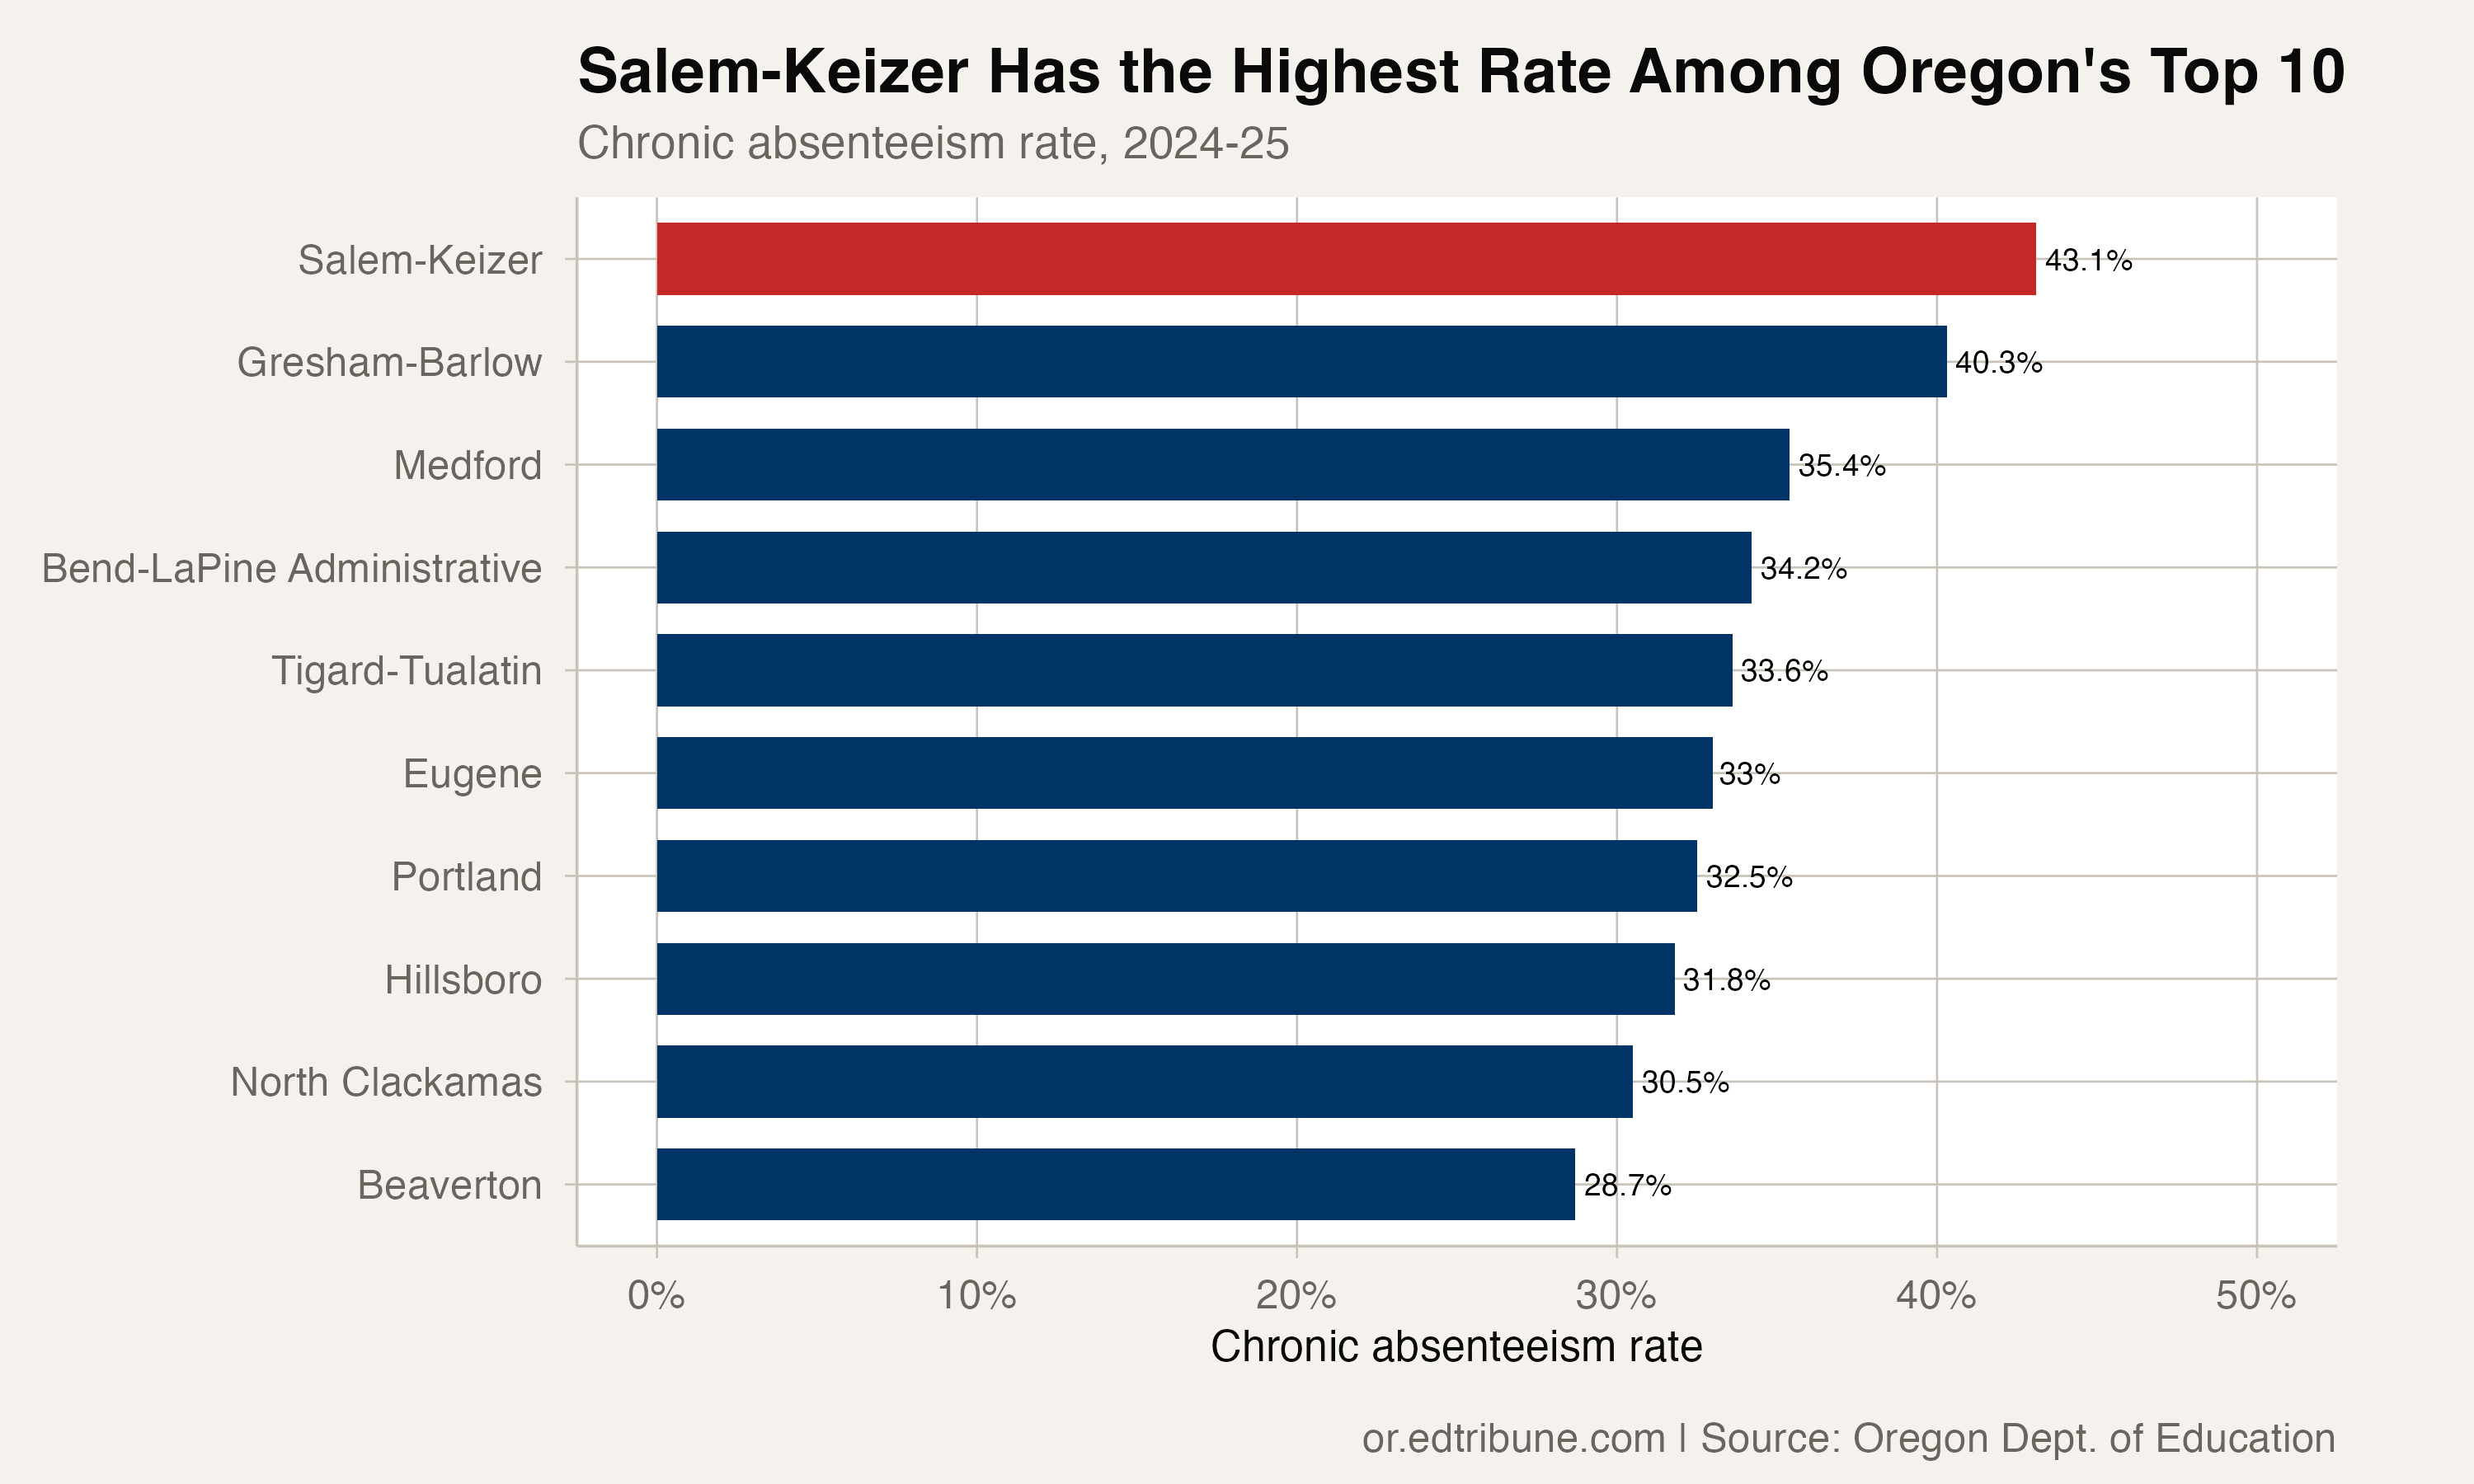
That is the kind of intervention a 43.1% chronic absenteeism rate demands. In 2024-25, Salem-Keizer (Oregon's third-largest district with 35,987 students) had the worst attendance of any top-10 district in the state. More than 15,500 students missed at least 10% of the school year. The rate has more than doubled from 21.2% in 2014-15.
The racial dimension
Salem-Keizer's student body is 47.9% Hispanic, and the attendance challenge falls disproportionately on those students. Hispanic students have a 48.3% chronic rate, nearly half. Native American students are at 48.7%, though that subgroup is small (232 students). Pacific Islander students: 58.0%.
White students, who make up 37.7% of enrollment, have a chronic rate of 37.1%. That is still high, but 11 points below the Hispanic rate.
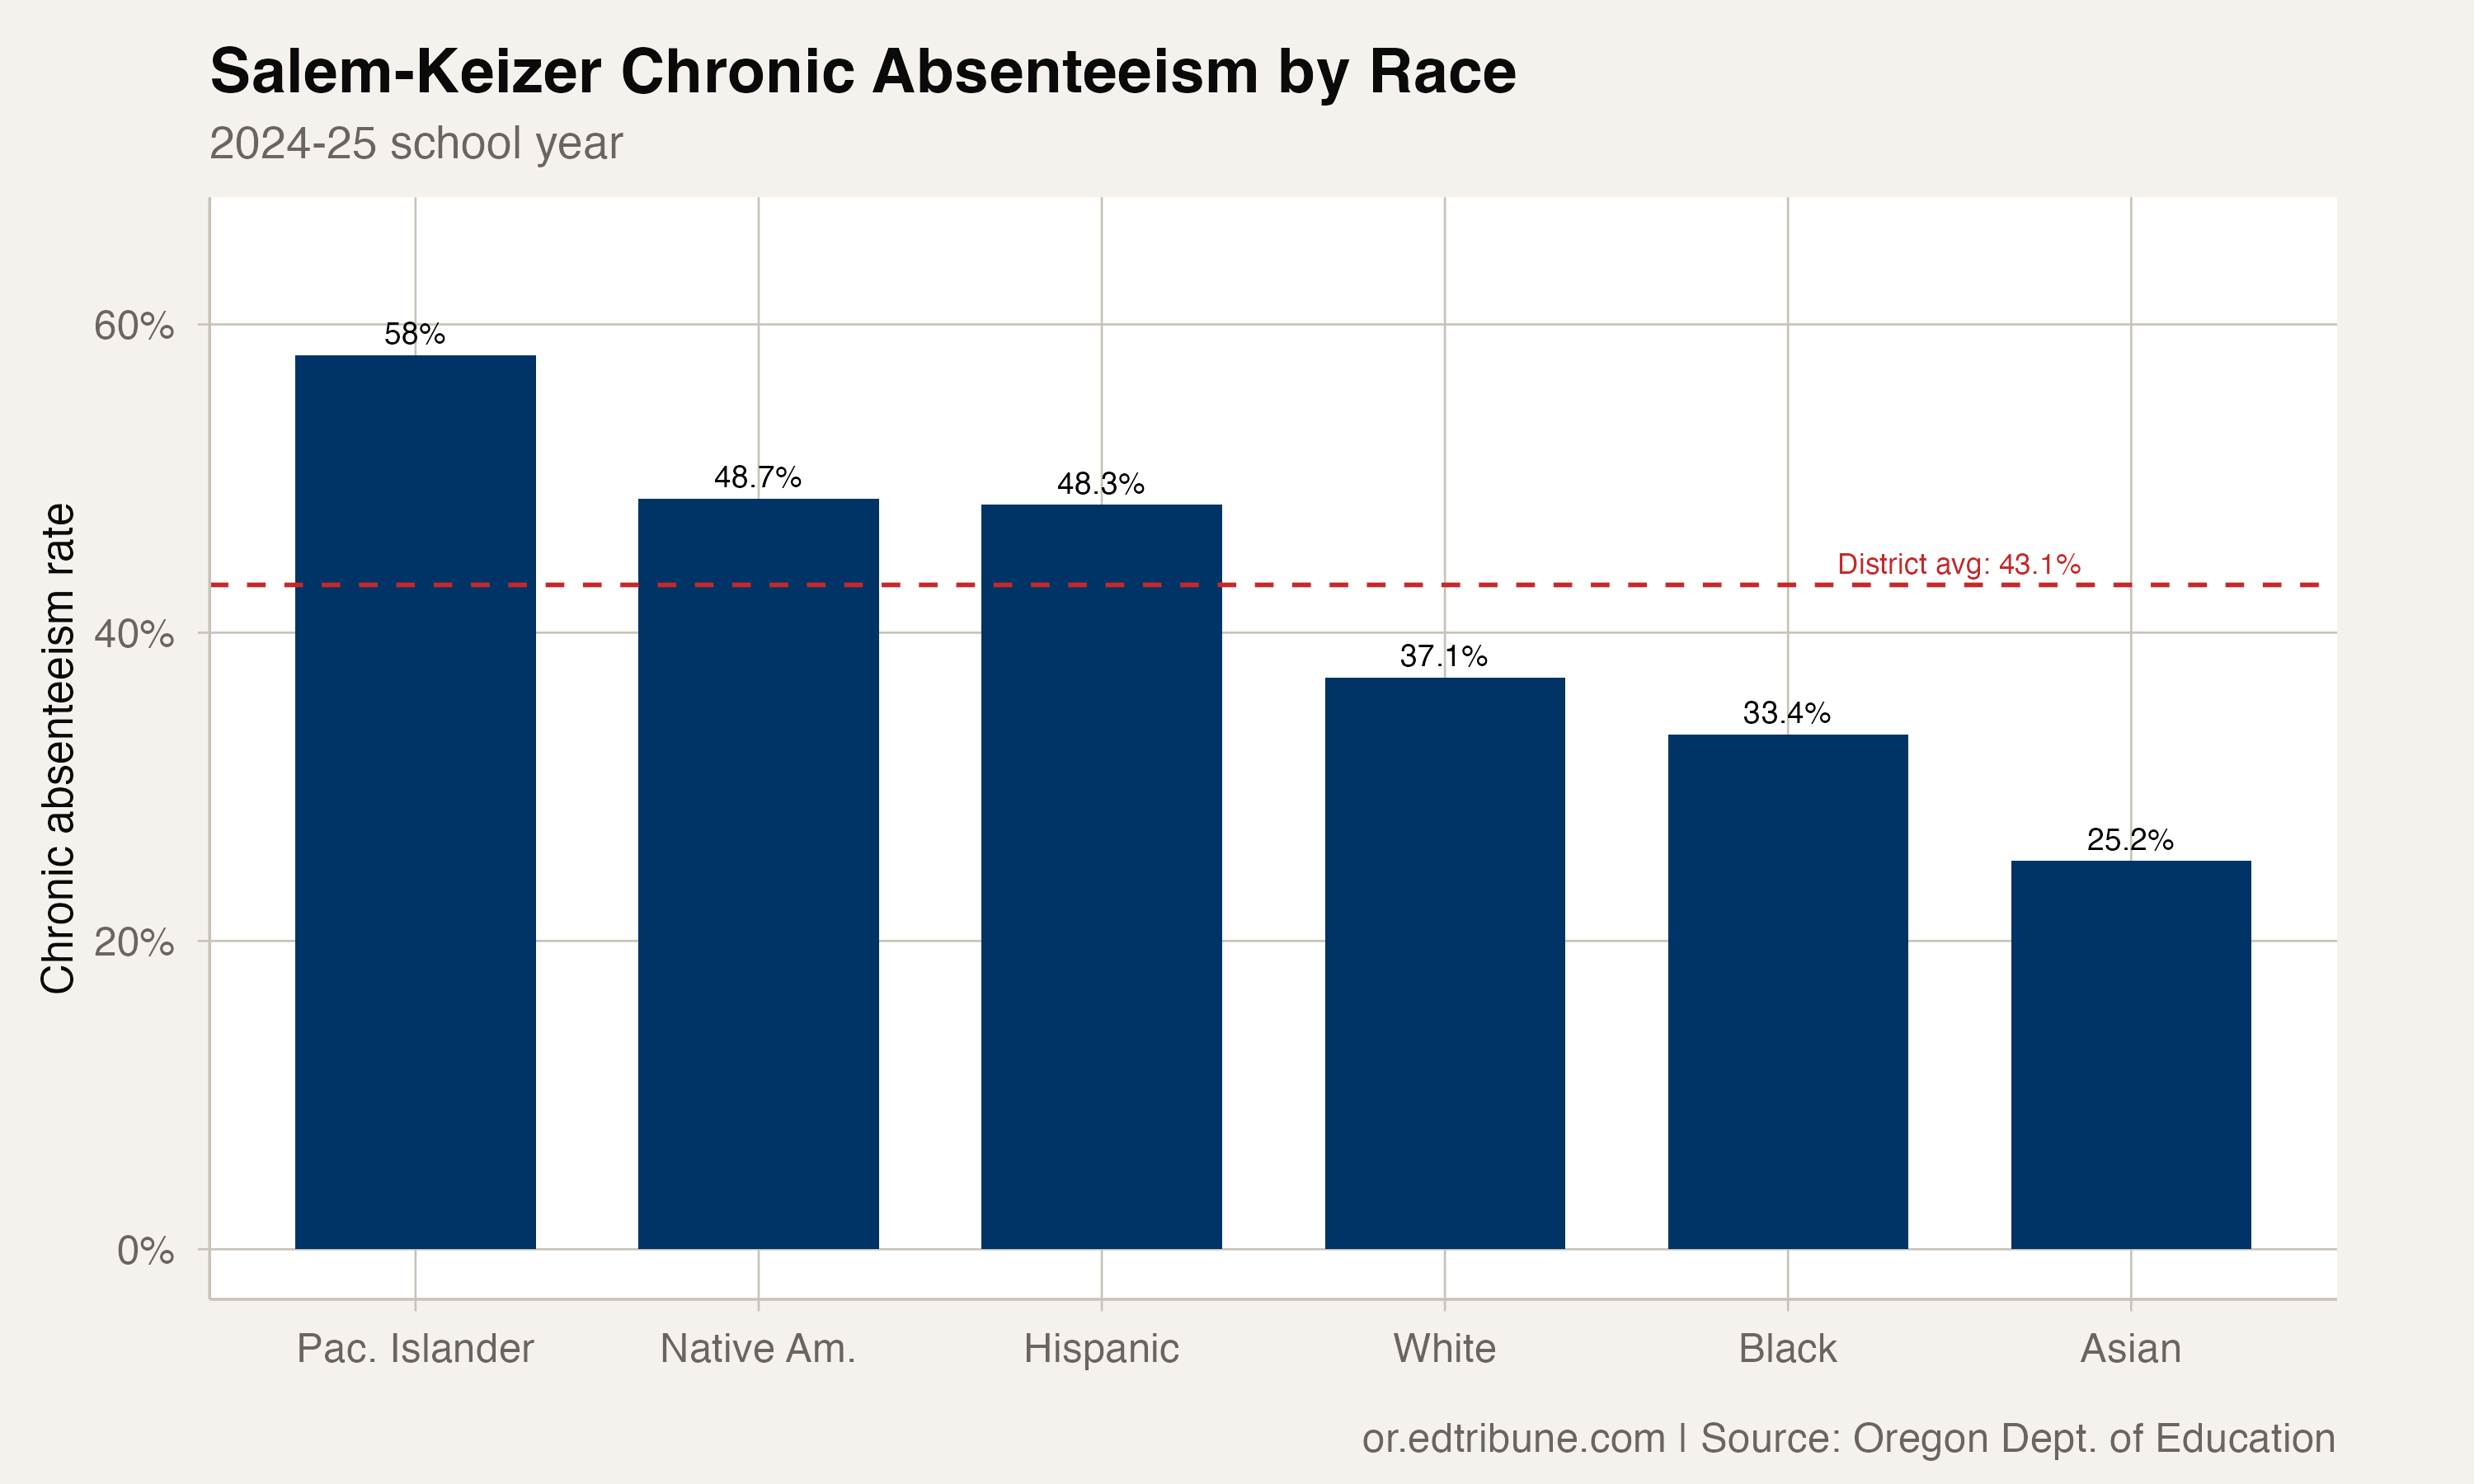
The racial gaps are not unique to Salem-Keizer. They mirror statewide patterns. But the scale matters. Salem-Keizer has more Hispanic students (17,232) than most Oregon districts have total enrollment. When 48.3% of 17,232 students are chronically absent, that is 8,323 children in one district, in one subgroup, missing too much school.
Standing out among the big districts
Salem-Keizer's 43.1% stands out even in a state where the average is 33.5%. Among Oregon's 10 largest districts, Salem-Keizer leads at 43.1%, with Gresham-Barlow↗ET next at 40.3%, and the range running down to Beaverton↗ET at 28.7%. Lake Oswego↗ET, outside the top 10 but Oregon's best-performing large district, sits at 18.1%, a 25-point gap from Salem-Keizer.
The district launched its "Every Day 24J!" attendance campaign, targeting the most chronically absent schools with coordinators, parent engagement, and incentive programs. Early reports showed some schools cutting chronic rates by a third. But the districtwide number has been stubbornly resistant: 47.9% in 2023, 44.0% in 2024, 43.1% in 2025. Progress, but slow.
The doubling
Salem-Keizer's pre-COVID rate of 21.2% was itself above the state average. The pandemic pushed it to 46.6% in 2022, then 47.9% in 2023 (nearly half the district) before the slow recovery began. Even after two years of improvement, the rate remains twice its pre-pandemic level.
The doubling is driven partly by demographics. Salem-Keizer's large immigrant community faces compounding attendance barriers: housing instability in the Willamette Valley, agricultural work that follows seasonal rhythms, transportation in a sprawling district that covers 236 square miles, and, since 2023, increased anxiety around immigration enforcement.
But demographics alone do not explain the gap between Salem-Keizer and Portland↗ET, which is more diverse and has a 32.5% rate. Portland's 4.4-point improvement in 2025 suggests that large, diverse districts can make faster progress than Salem-Keizer has managed.
At 43.1%, Salem-Keizer accounts for more students who are chronically absent than any other Oregon district in absolute terms. Whether the "Every Day 24J!" campaign and the governor's phone calls can bend the curve faster than the 2-point-per-year pace of the last two years is the test.
Detailed code that reproduces the analysis and figures in this article is available exclusively to EdTribune subscribers.
Discussion
Sign in to join the discussion.
Loading comments...