In this series: Oregon Chronic Absenteeism.
Correction (May 29, 2026): An earlier version of this article said the Hispanic-white absence gap had "tripled" since 2015. The gap actually grew roughly sixfold over that span (from 1.6 to 9.8 points). The headline and description have been corrected. The 2022 peak gap was 10.9 points (previously stated as 11.4), and Salem-Keizer's Hispanic enrollment share is about 48% (previously stated as 48.1%).
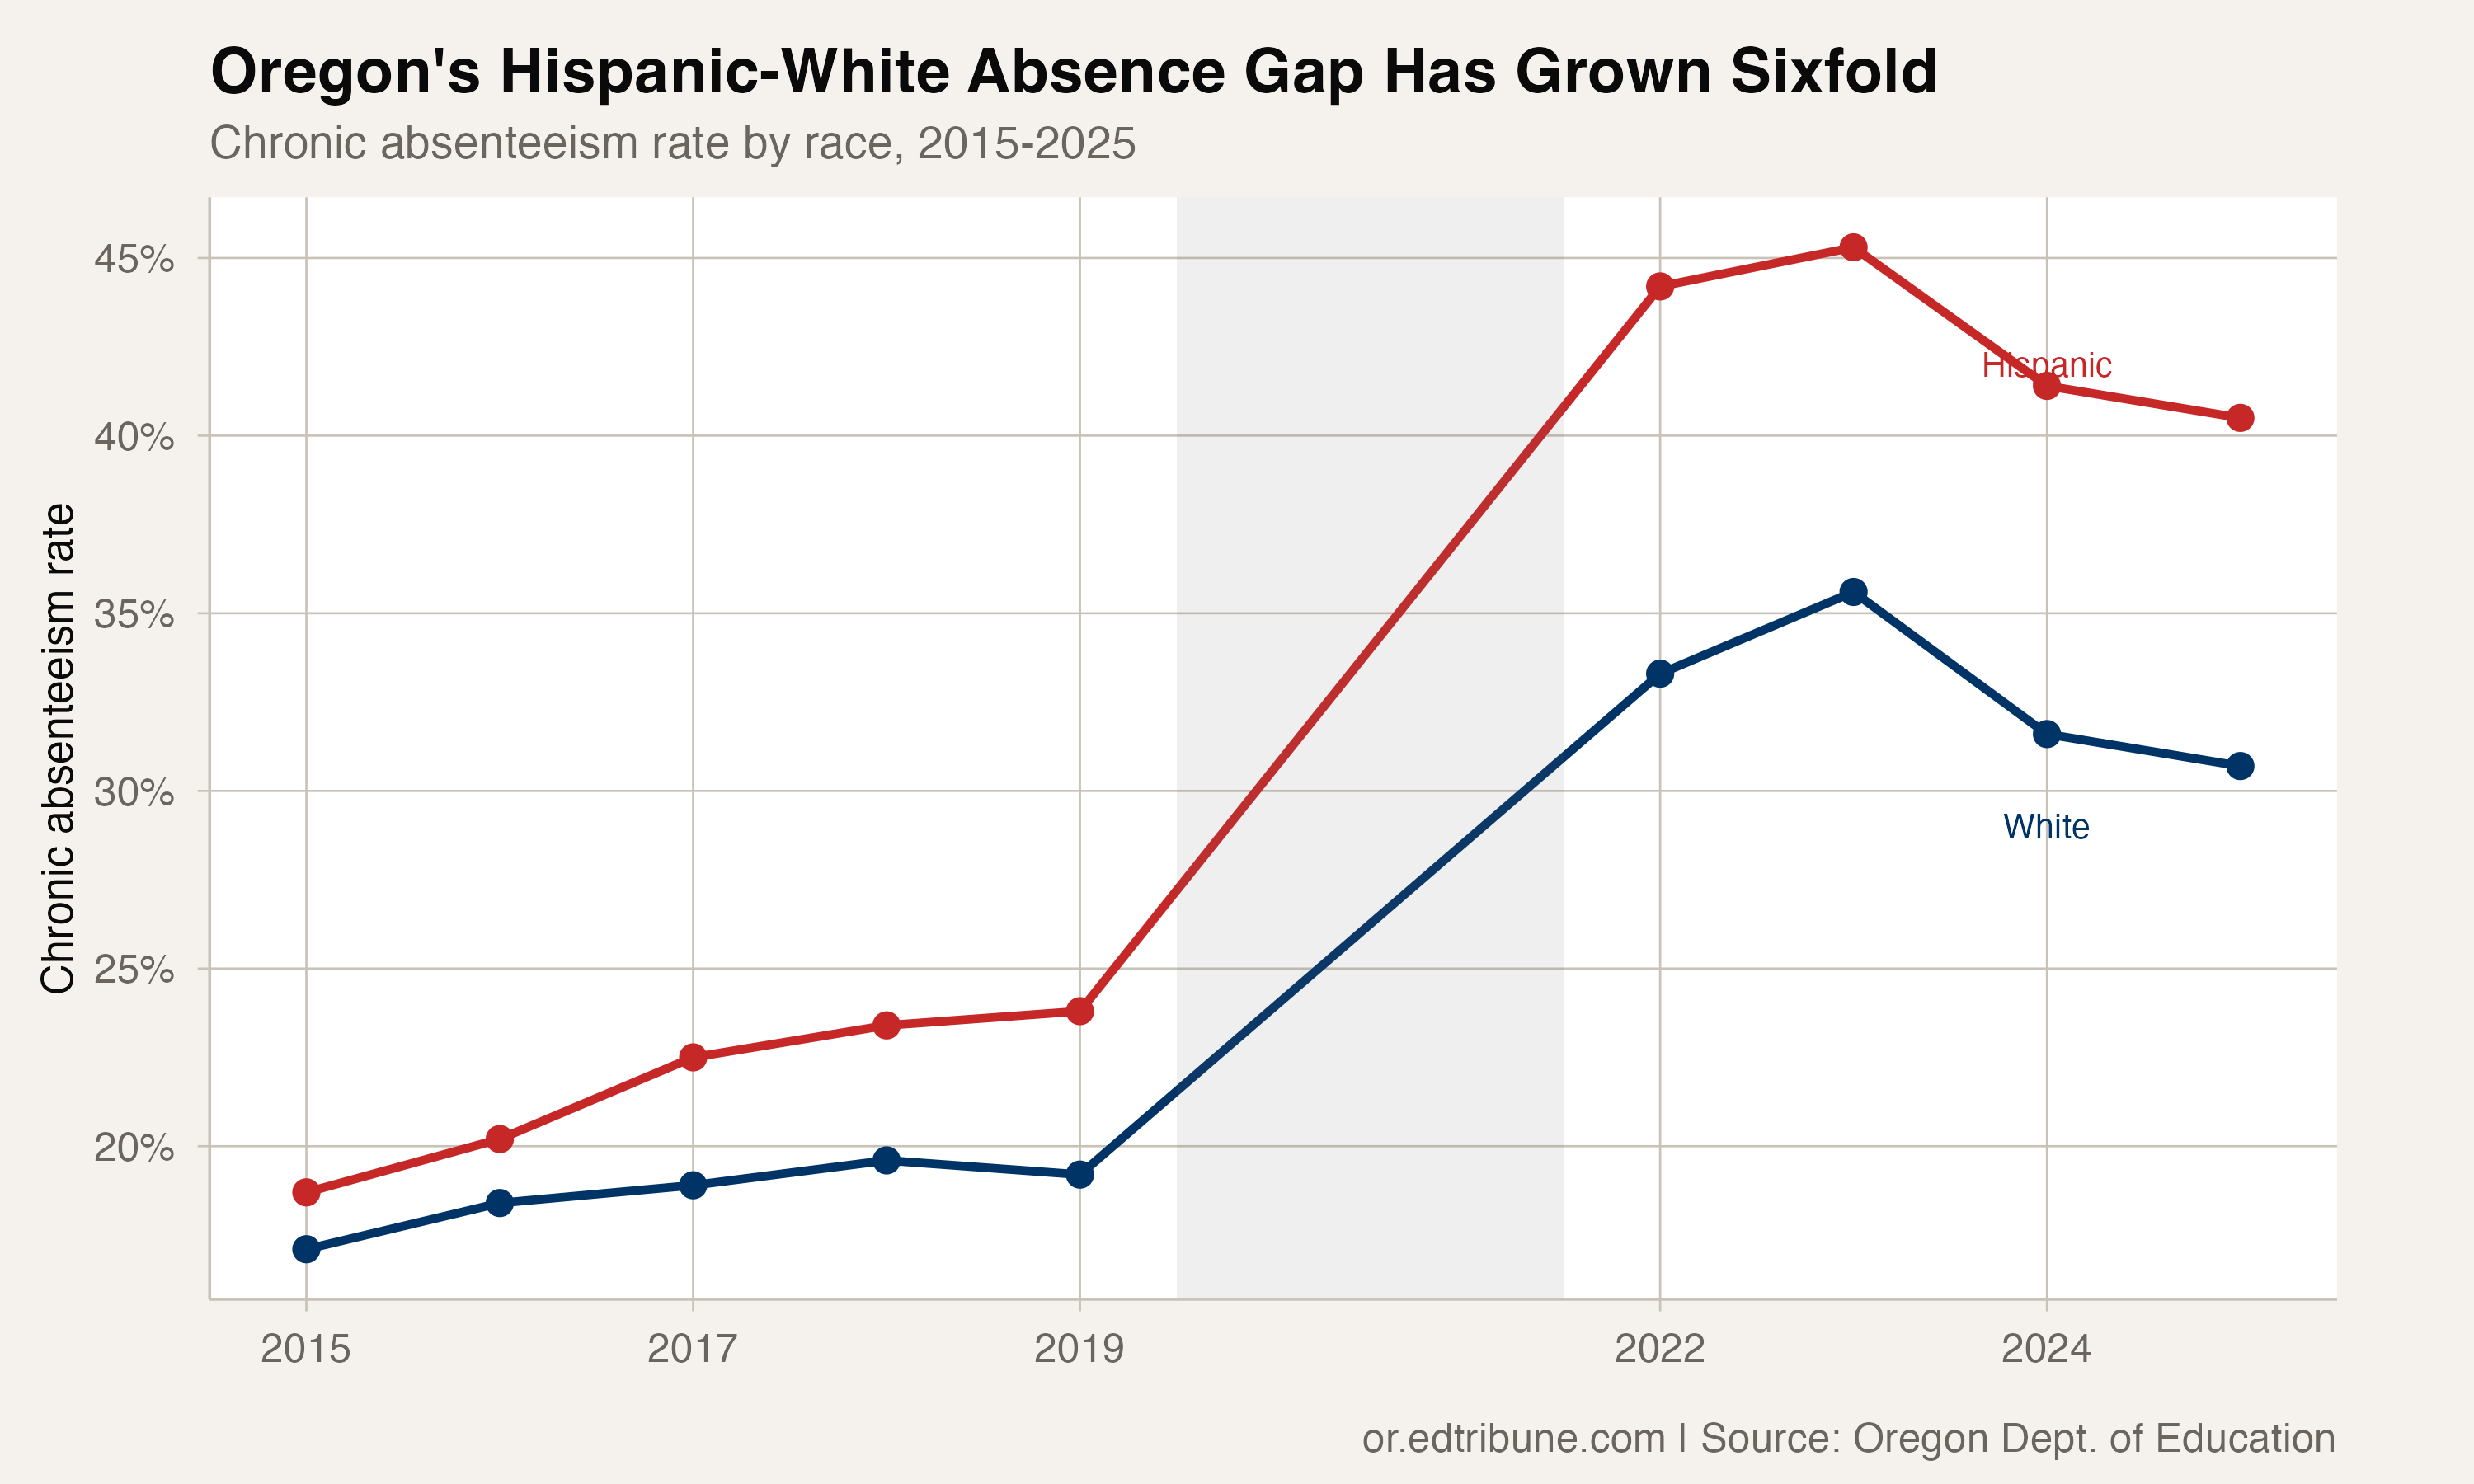
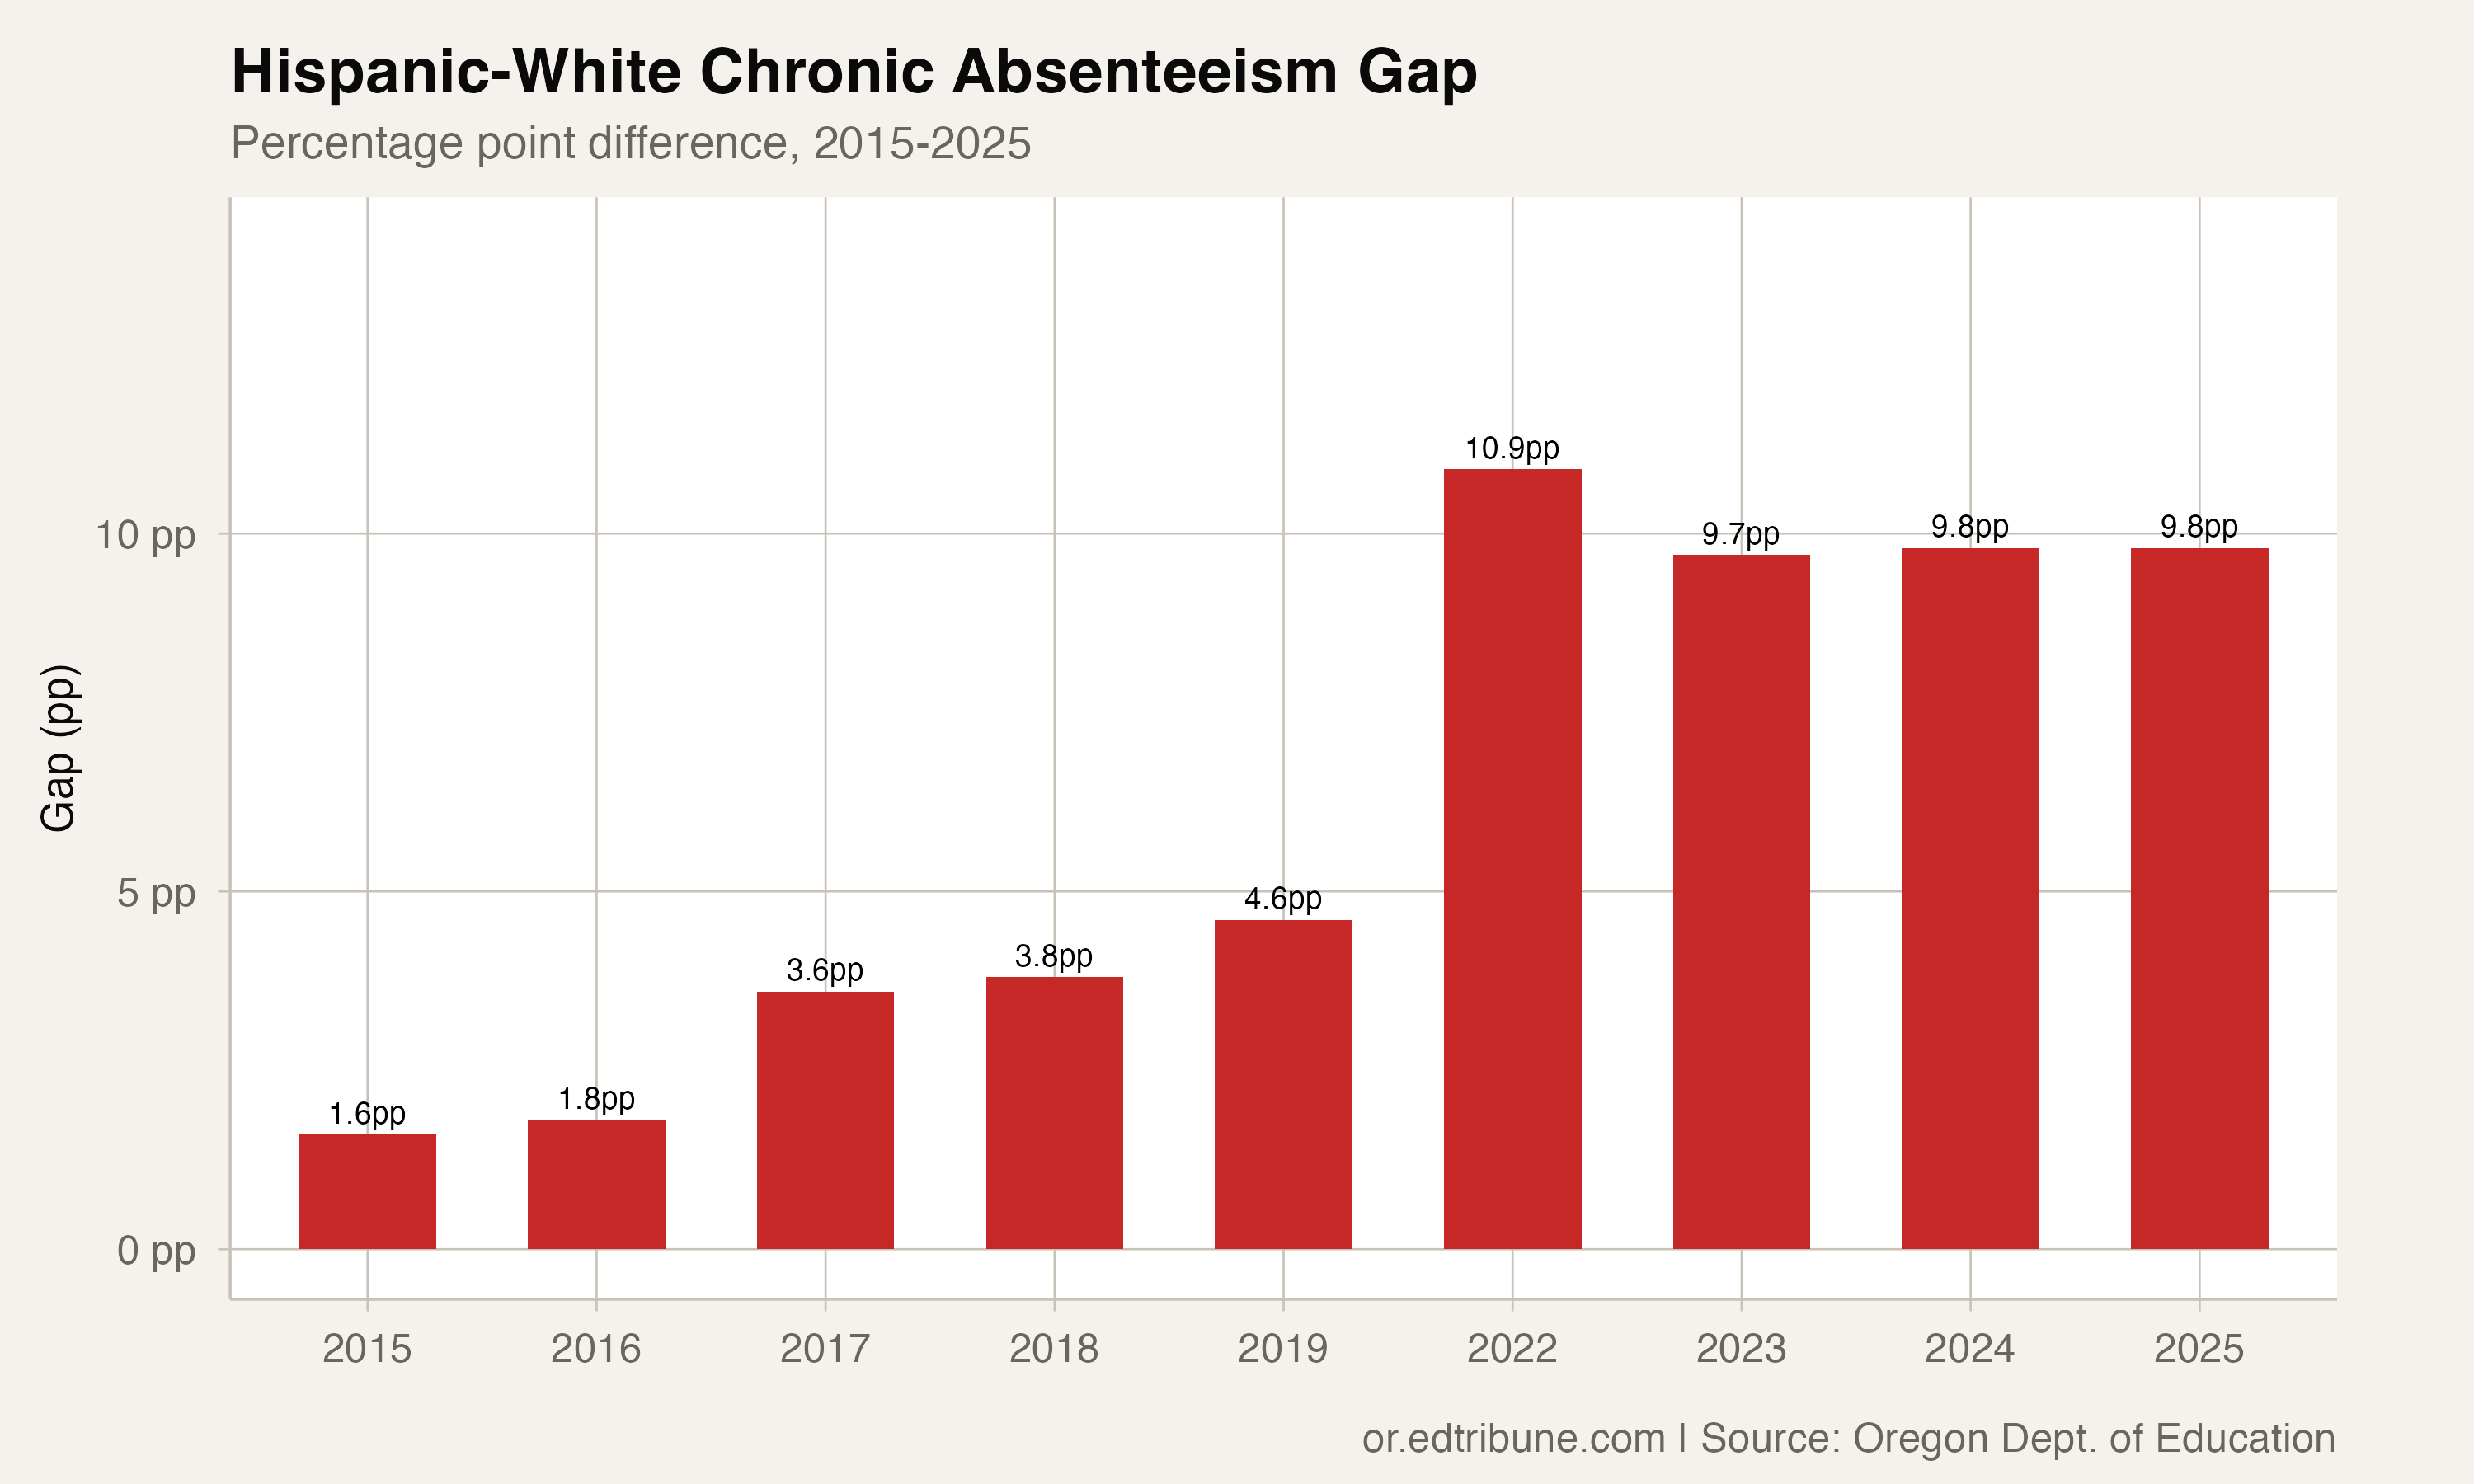
In 2014-15, the gap between Hispanic and white chronic absenteeism in Oregon was 1.6 percentage points. Hispanic students were at 18.7%, white students at 17.1%. Close enough that, at a glance, attendance looked racially equitable.
A decade later, that gap has grown roughly sixfold to 9.8 points. Hispanic students are chronically absent at 40.5% (about two in five), while white students are at 30.7%. Both rates are high. But they are high in different magnitudes, and the distance between them has widened in every era of the data.
The widening accelerated during COVID
The gap was 1.6 points in 2015. By 2019, it had already grown to 4.6 points, nearly tripling before the pandemic. COVID then widened it further: 10.9 points in 2022, the widest on record. It has since narrowed slightly to 9.8 points, but that narrowing came from white students worsening faster in the recovery, not from Hispanic students improving faster.
The pre-COVID widening is important context. Whatever forces are driving the gap (housing instability, agricultural work patterns, transportation, immigration enforcement anxiety) were operating before March 2020. The pandemic amplified an existing divergence. It did not create one.
137,893 students
Oregon's Hispanic student population is 137,893, roughly 26.5% of total enrollment and the largest non-white group in the state. At 40.5% chronic absenteeism, approximately 55,850 Hispanic students missed at least 10% of the school year. That is more Hispanic students who are chronically absent than the total enrollment of Portland Public Schools↗ET.
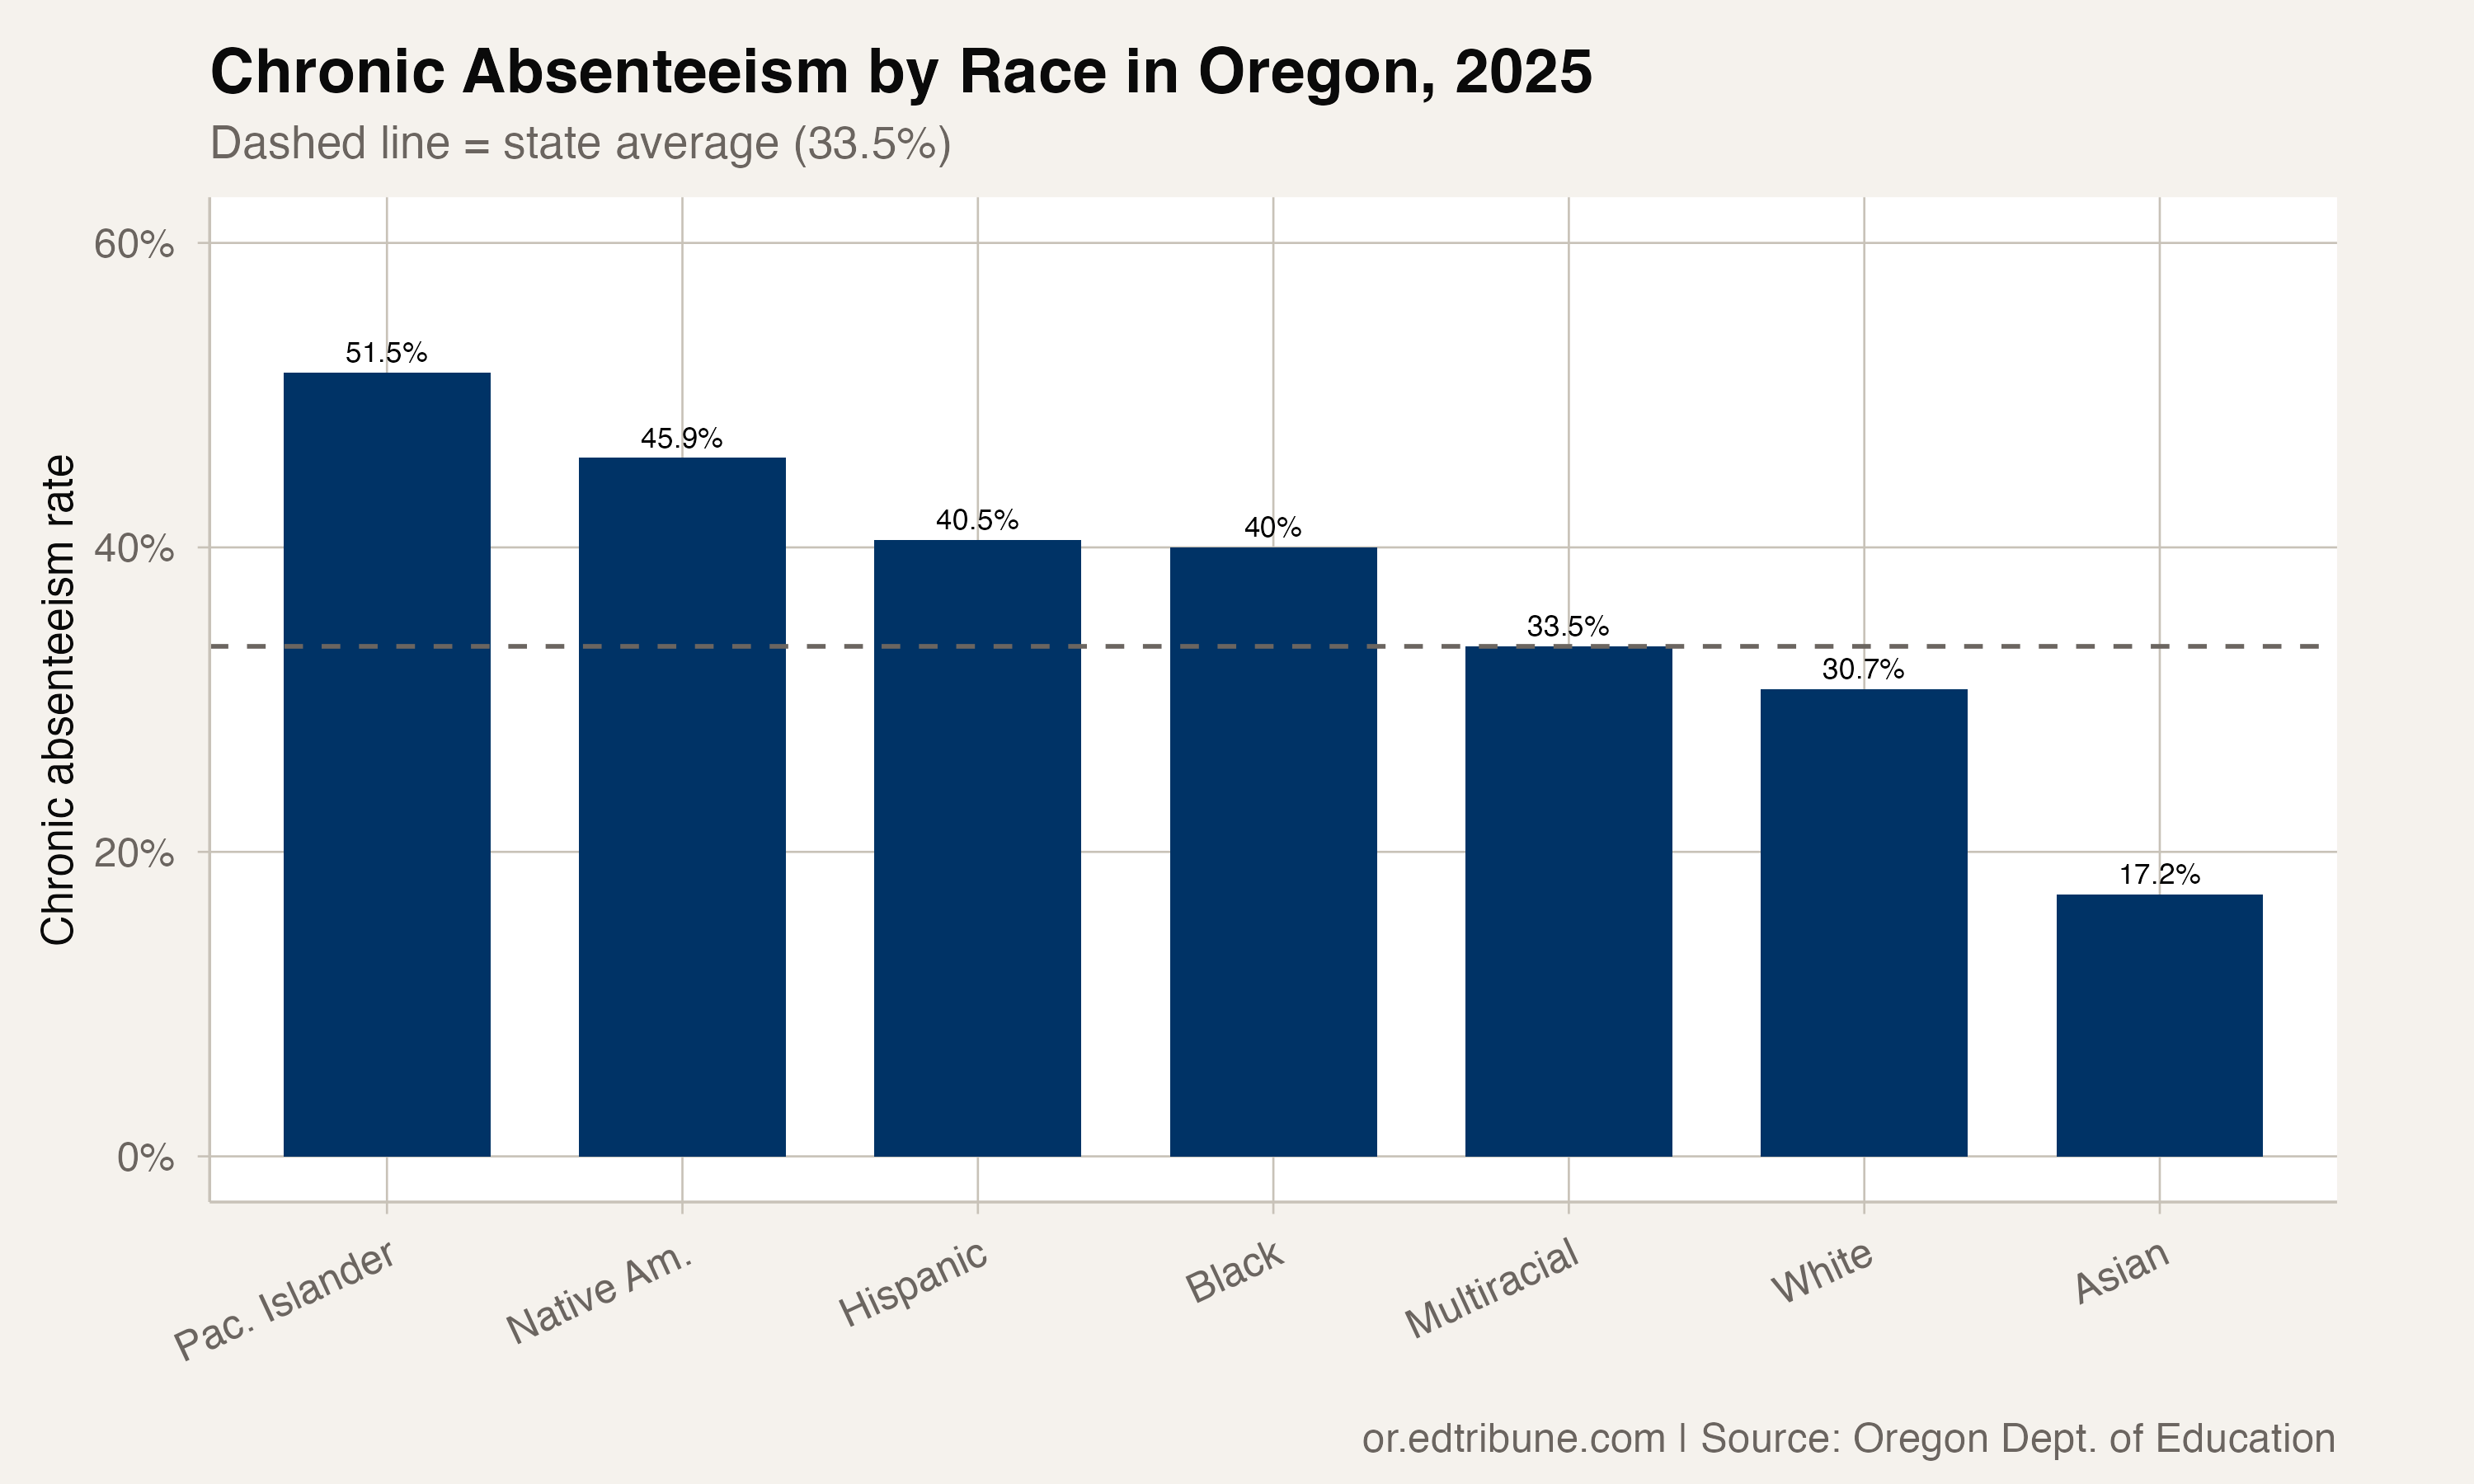
Hispanic students do not have the highest rate among racial groups. Pacific Islander students are at 51.5%, and Native American students are at 45.9%. But those populations are much smaller, at 4,458 and 5,516 students respectively. The size of the Hispanic student population means that even a modest improvement in their rate would move the statewide number.
The compounding barriers
The attendance research on Hispanic student absence in Oregon points to a familiar set of factors that compound. Agricultural work in the Willamette Valley and eastern Oregon follows seasonal patterns that pull older students out of school during harvest. Housing instability in Oregon's tight rental market forces families to move mid-year, disrupting attendance. Transportation in sprawling rural and suburban districts is a persistent barrier.
Since 2023, immigration enforcement concerns have added a new variable. Multiple Oregon school districts reported families keeping children home during ICE operations. The Oregon Department of Education issued guidance affirming that schools are safe spaces regardless of immigration status, but anxiety persists.
Salem-Keizer↗ET, where about 48% of students are Hispanic and 48.3% of Hispanic students are chronically absent, is the clearest illustration. A single district accounts for more than 8,300 Hispanic students who are chronically absent.
A gap that was closing, then stopped
The brief hope in the data is that the gap narrowed from 10.9 to 9.8 points between 2022 and 2025. But almost all of that narrowing happened in the first year of recovery (2023). Since then, the gap has been flat at roughly 10 points.
A 10-point racial gap in chronic absenteeism, sustained across three years of recovery, suggests the interventions that are improving attendance overall are reaching white and Hispanic families at roughly equal rates. The gap is not widening. But it is not closing either. The same forces that grew it roughly sixfold from 1.6 points to 9.8 over a decade remain in place.
Detailed code that reproduces the analysis and figures in this article is available exclusively to EdTribune subscribers.
Discussion
Sign in to join the discussion.
Loading comments...