Correction (July 21, 2026): The earlier article used a Portland student count that is not present in the current package row, understated the 2015 Native American-white gap, and called the current statewide rate the highest in the panel even though the package reports a higher 2022 value. It also offered causal and historical explanations not established by the data. This version corrects those points and rebuilds every chart and claim from executed Oregon package output.
Oregon's Native American state row reported 5,516 students and a 45.9% chronic absenteeism rate in 2024-25. At the start of the package panel in 2014-15, it reported 7,853 students and a 29.6% rate.
Across those endpoints, reported enrollment fell by 2,337 students, or 29.8%, while the chronic absenteeism rate rose by 16.3 percentage points.
The current rate was below the panel peak
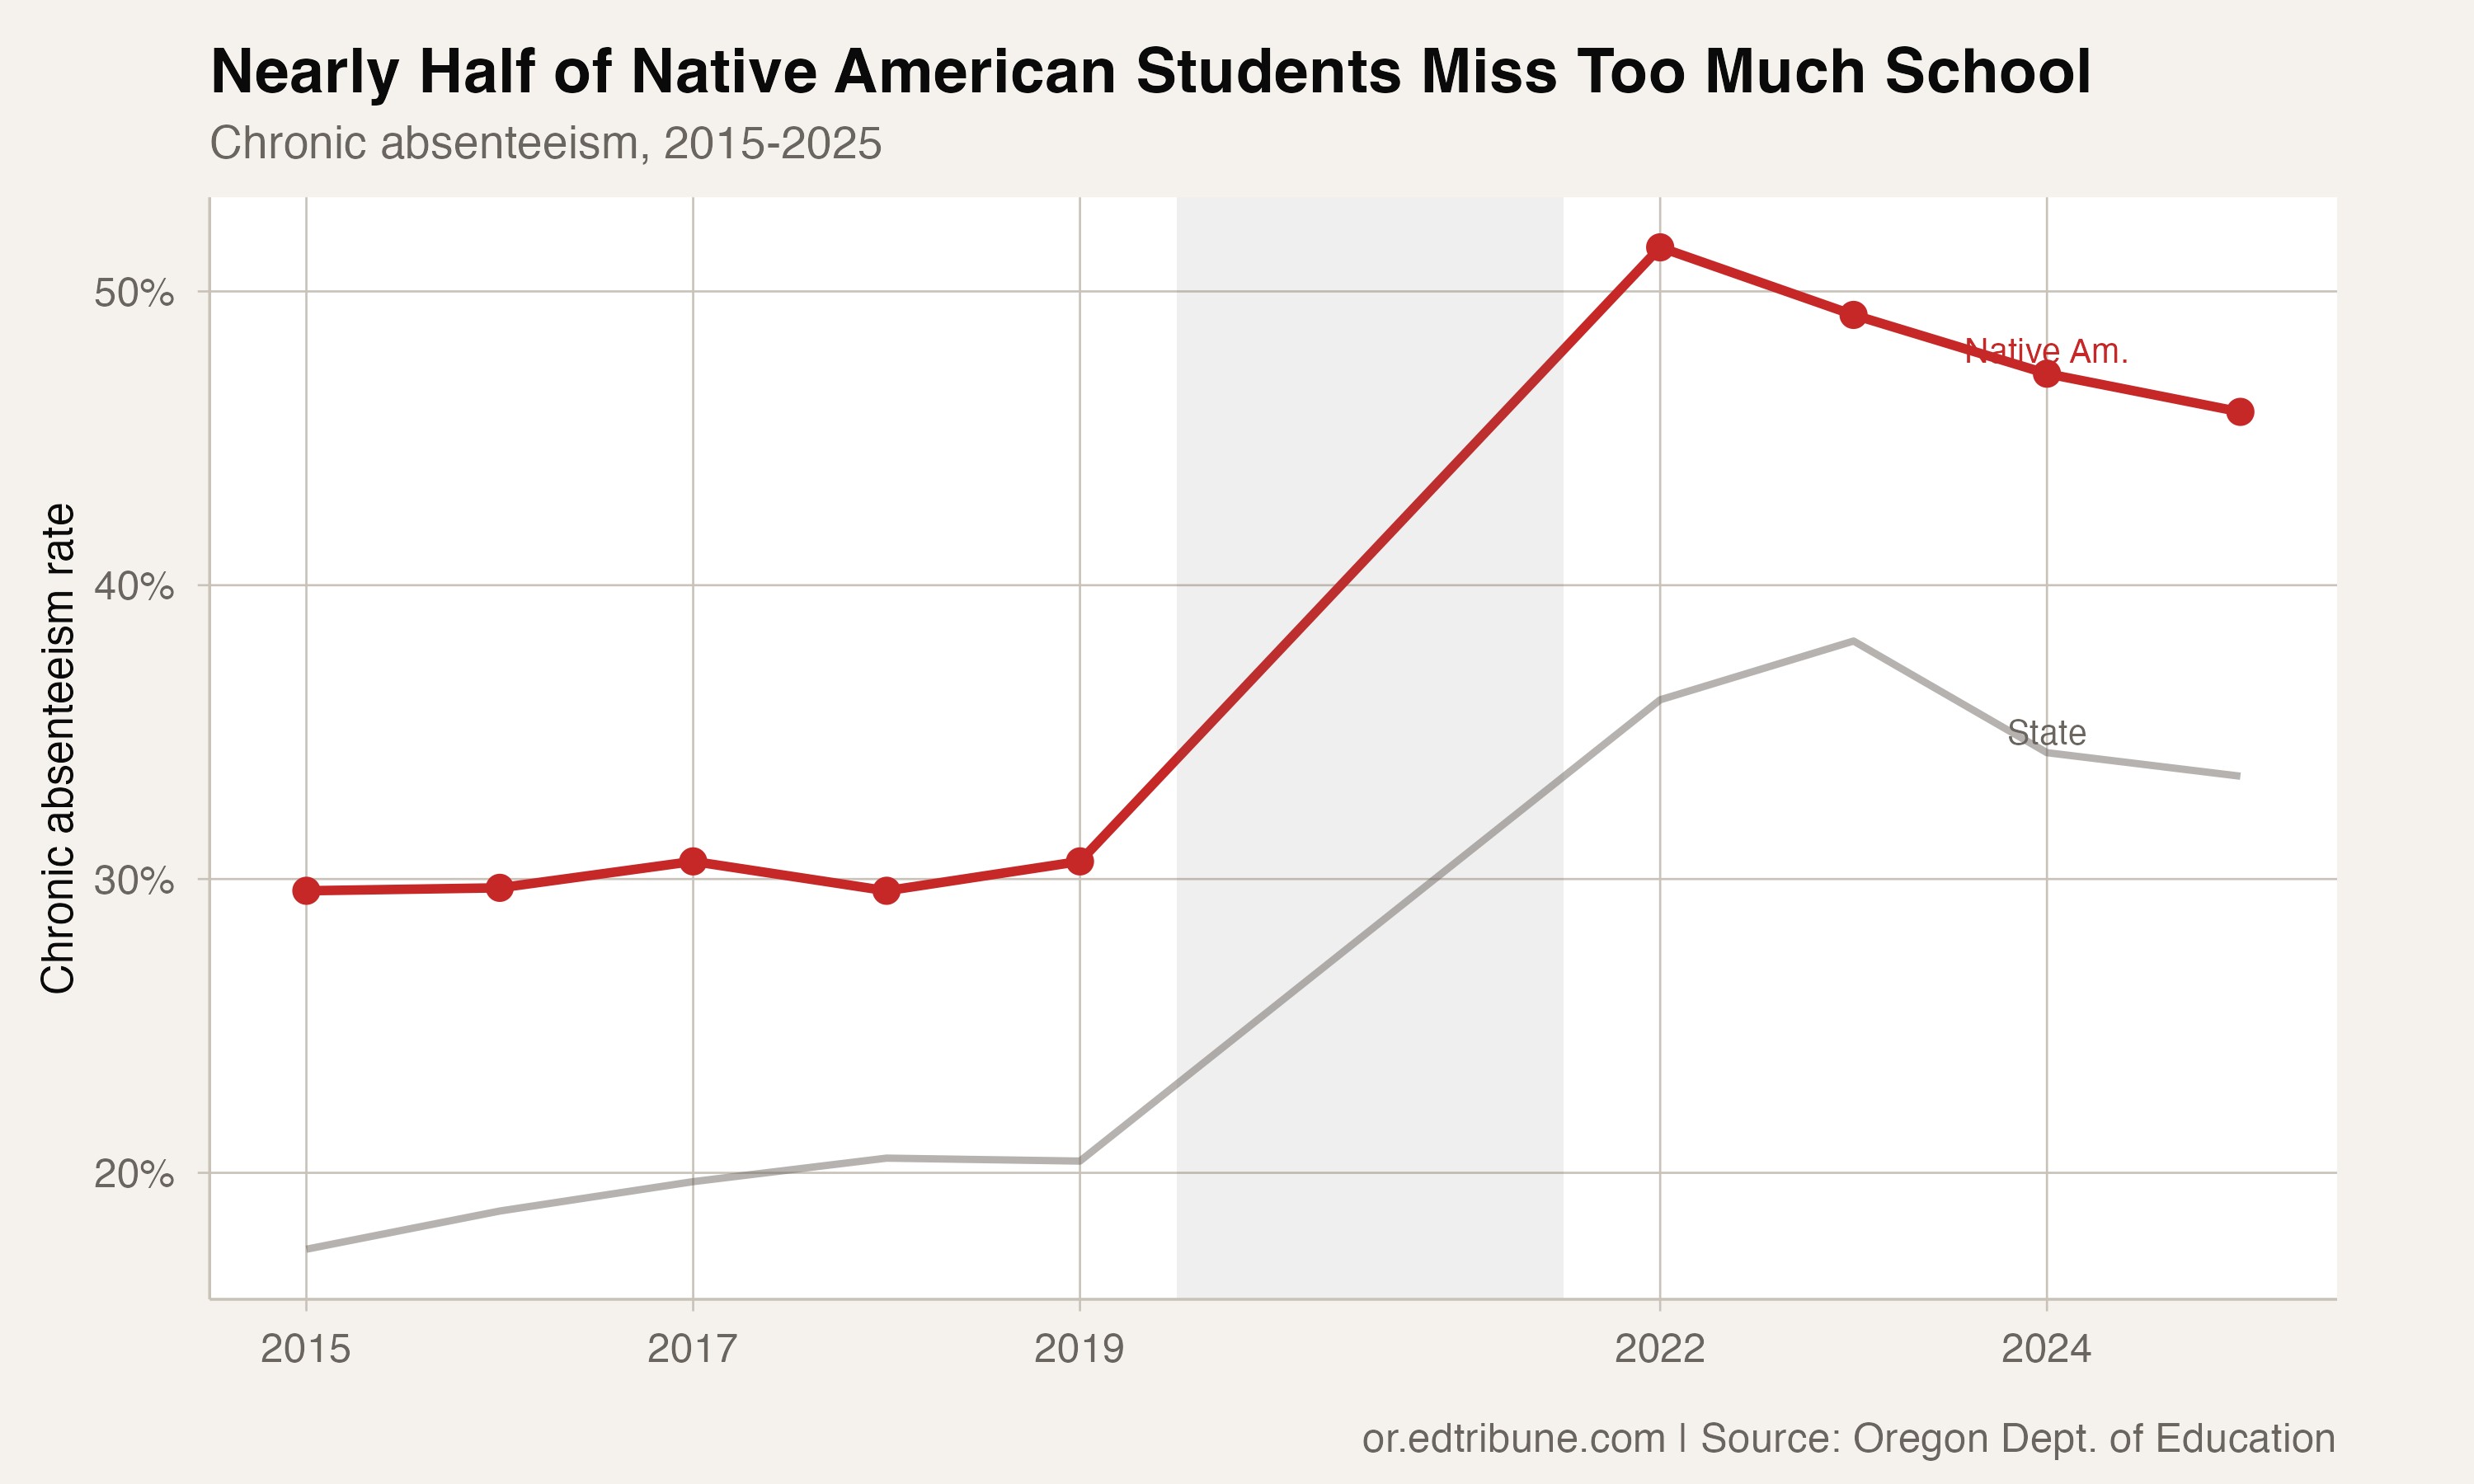
The statewide Native American rate did not rise continuously to a record in 2024-25. It was 29.7% in 2015-16, 30.6% in 2016-17, 29.6% in 2017-18, and 30.6% in 2018-19.
The next package observation is 2021-22, when the rate reached the nine-observation panel maximum of 51.5%. It then fell to 49.2% in 2022-23, 47.2% in 2023-24, and 45.9% in 2024-25. The current rate was 5.6 points below the 2021-22 peak.
The package panel omits 2019-20 and 2020-21, so it does not support claims about the missing annual transitions.
Enrollment fell overall, but not every year
The reported statewide Native American enrollment declined from 7,853 in 2014-15 to 7,602, 7,326, 7,082, and 6,667 in the four following observations. It was 5,858 in 2021-22, rose to 5,927 in 2022-23, then fell to 5,656 and 5,516.
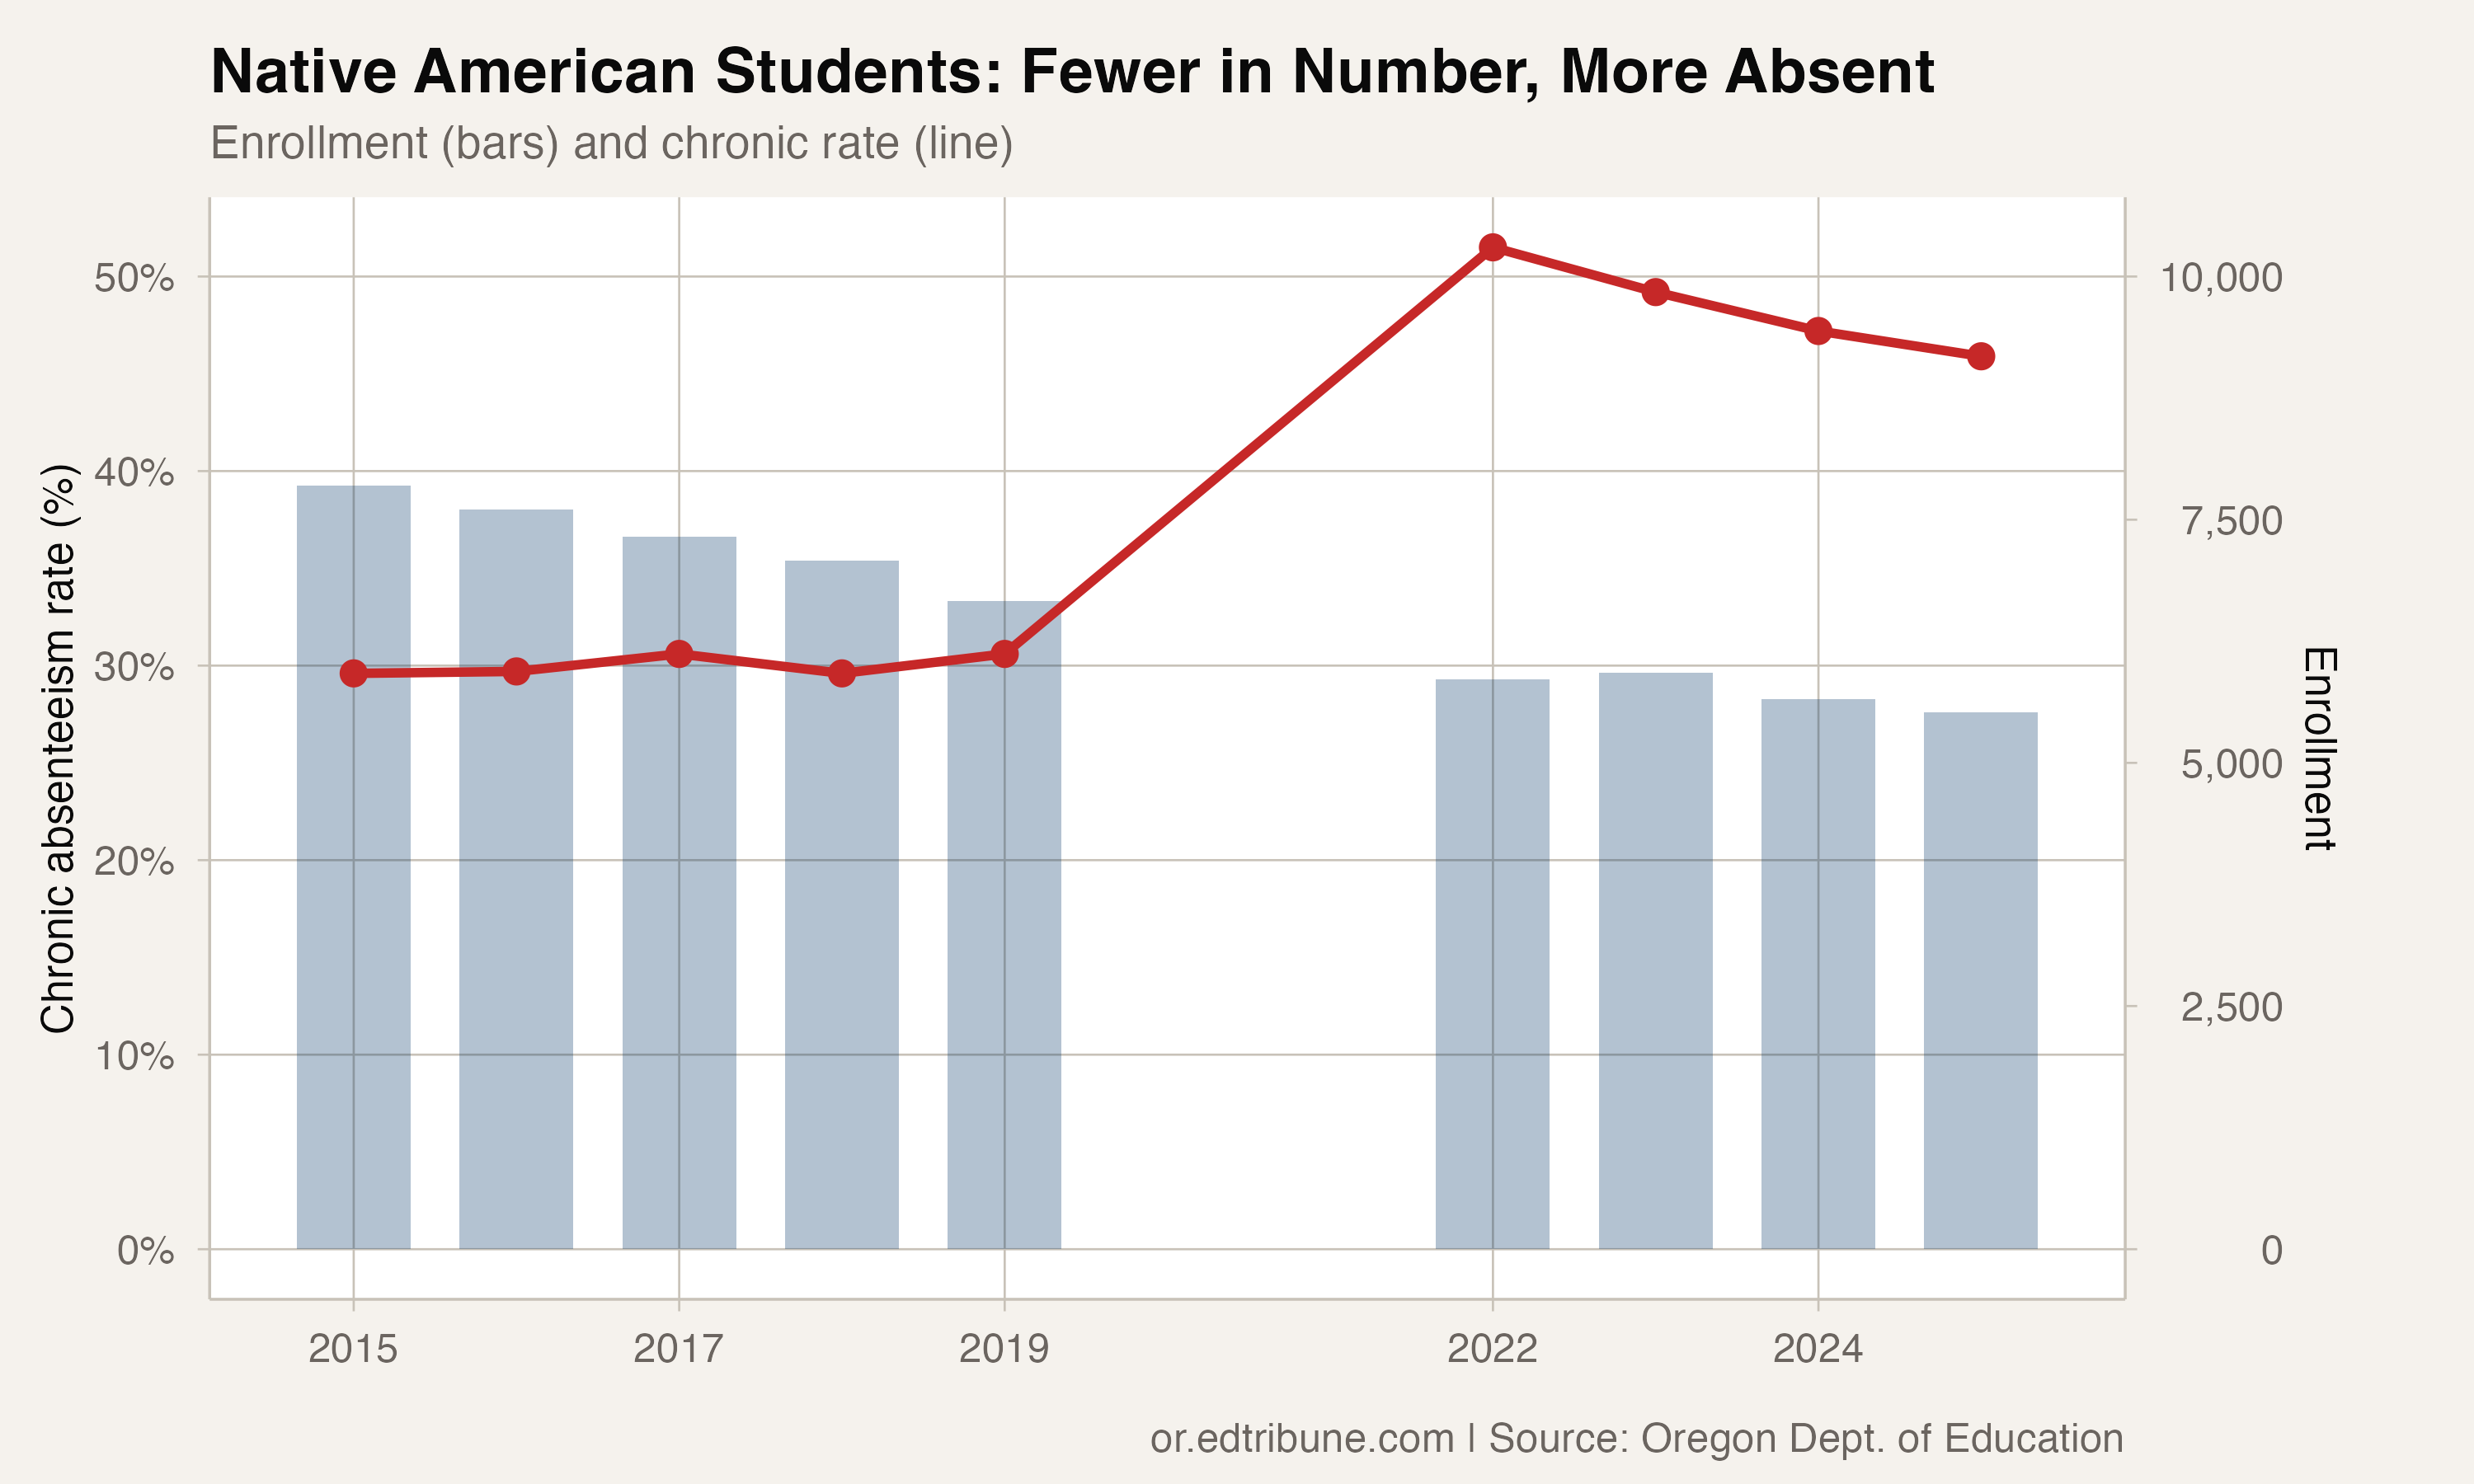
That sequence corrects the earlier statement that enrollment fell steadily. The endpoint decline is clear, but one observed year-to-year increase occurred within the panel.
The gap with the white state row
In 2014-15, the Native American state rate was 29.6% and the white state rate was 17.1%, a 12.5-point difference. The earlier article reported that baseline gap incorrectly.
In 2024-25, the corresponding rates were 45.9% and 30.7%, a 15.2-point difference. The endpoint gap therefore increased by 2.7 points.
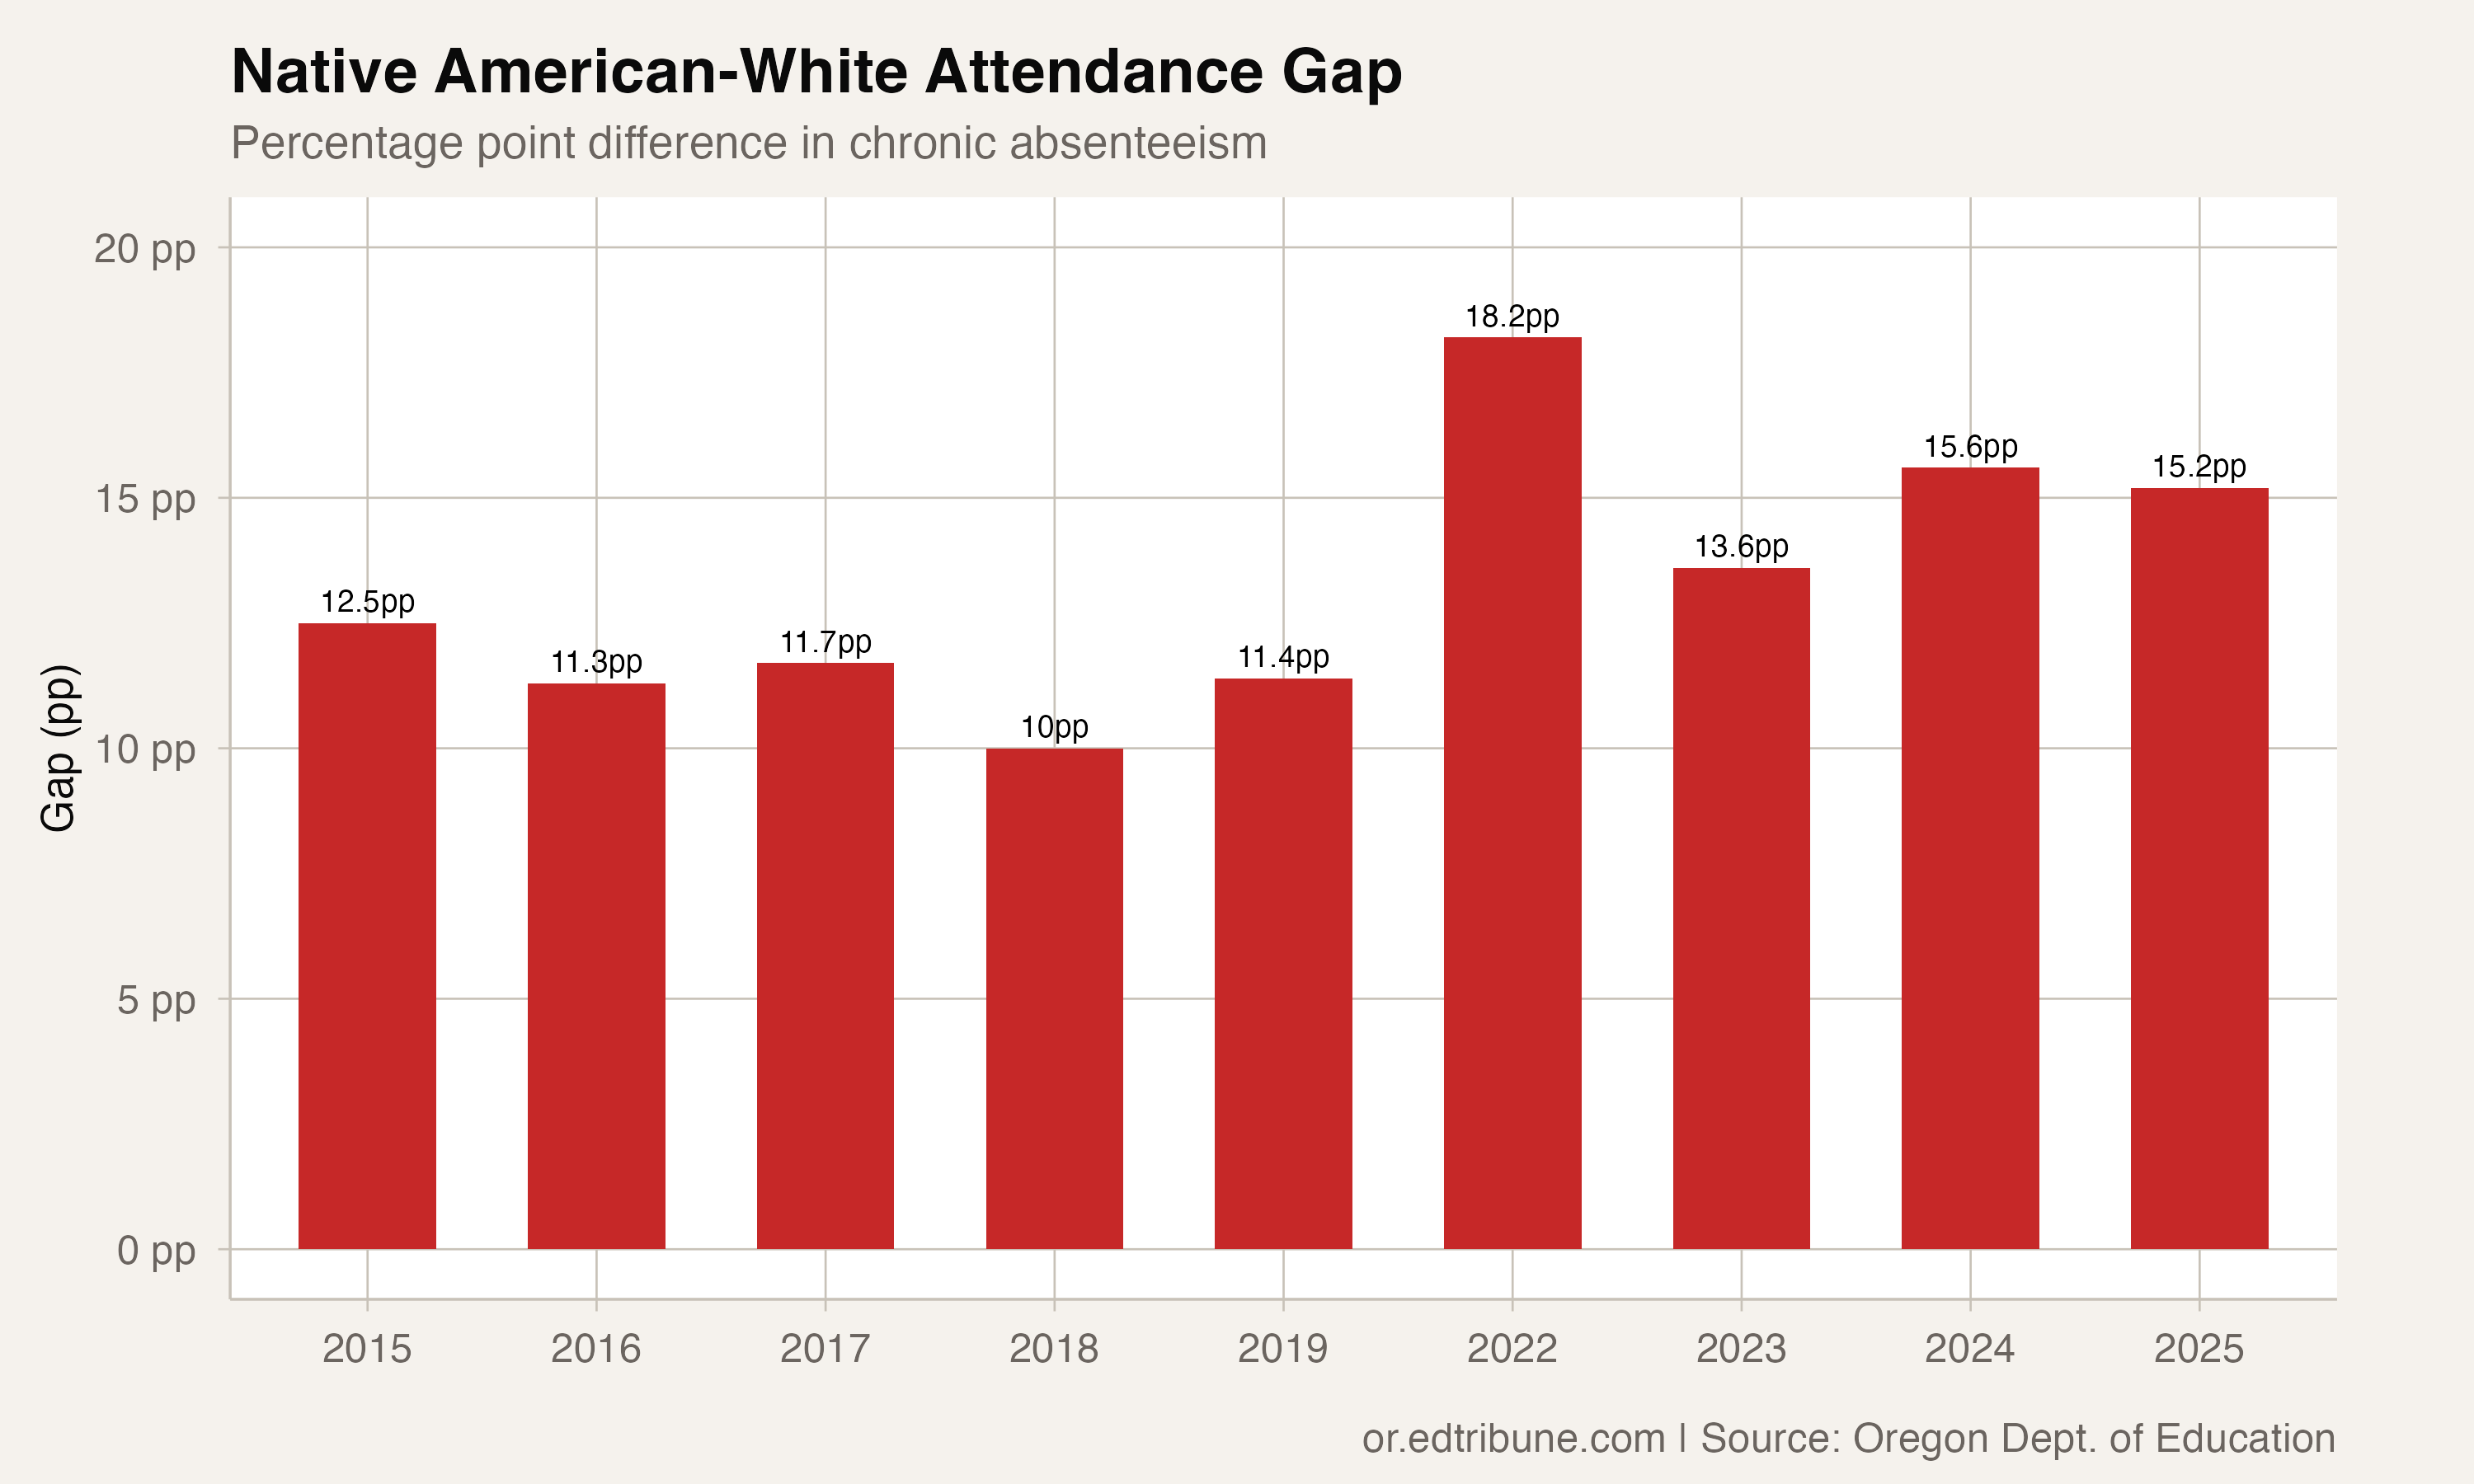
The executed analysis does not rank that difference against every other racial subgroup, so the earlier claim that it was the second-largest racial gap has been removed.
Portland's package row
Portland SD 1J's Native American row reported 184 students and a 64.7% chronic absenteeism rate in 2024-25. The earlier article reported 1,098 students, but that value is not in the current filtered package row.
In 2014-15, Portland's row reported 380 students and a 30.8% rate. The endpoint enrollment change was a decline of 196 students, while the rate increased by 33.9 points.
Portland's rate peaked at 68.8% in 2021-22 and then fell to 64.7%, a 4.1-point decline. The current Portland rate was 18.8 points above the current statewide Native American rate.
What the package can and cannot show
The analysis uses nine published years of Oregon Department of Education data, authoritative state subgroup rows for statewide claims, and the Portland district subgroup row for the local comparison. It establishes reported enrollment, rates, gaps, and changes within that panel.
It does not establish why enrollment changed, where students went, how students identify outside this reporting category, which historical forces explain the rates, or whether particular programs have sufficient capacity. Those unsupported explanations have been removed from the corrected article.
Detailed code that reproduces the analysis and figures in this article is available exclusively to EdTribune subscribers.
Discussion
Sign in to join the discussion.
Loading comments...