In this series: Oregon Chronic Absenteeism.
Correction, September 5, 2026: This article originally reported that 16 of 178 Oregon districts had returned to their pre-pandemic chronic absenteeism levels, and named Nyssa and Marcola among them. Those figures came from the Oregon Department of Education's district-level rows, which count students enrolled in district-sponsored online programs while publishing no attendance figures for those programs' own school rows. A district's rate can move several points because its online enrollment moved, not because anyone's attendance changed. Every rate below is now computed from the school rows the state actually publishes, at both ends of the comparison. On that basis 14 of 180 districts have recovered, and neither Nyssa nor Marcola is one of them: Nyssa's published schools reported 18.3% in 2024-25 against 16.9% before the pandemic, and Marcola's two physical schools reported 21.2% against 17.8%. Brookings-Harbor is now the largest recovered district. The headline, the recovery counts, the large-district figures and all three charts have been corrected.
Before the pandemic, Nyssa↗ET reported a chronic absenteeism rate of 16.9% across its schools. Marcola reported 14.2%. Brookings-Harbor reported 29.3%. These are small districts in rural Oregon, a farming town in Malheur County, a timber community east of Eugene, a fishing village on the southern coast.
In 2024-25, one of the three was below its pre-COVID rate. Brookings-Harbor came in at 27.0%, still high, but lower than the 29.3% it posted in 2019. Nyssa was at 18.3% and Marcola at 21.2%, both above where they started.
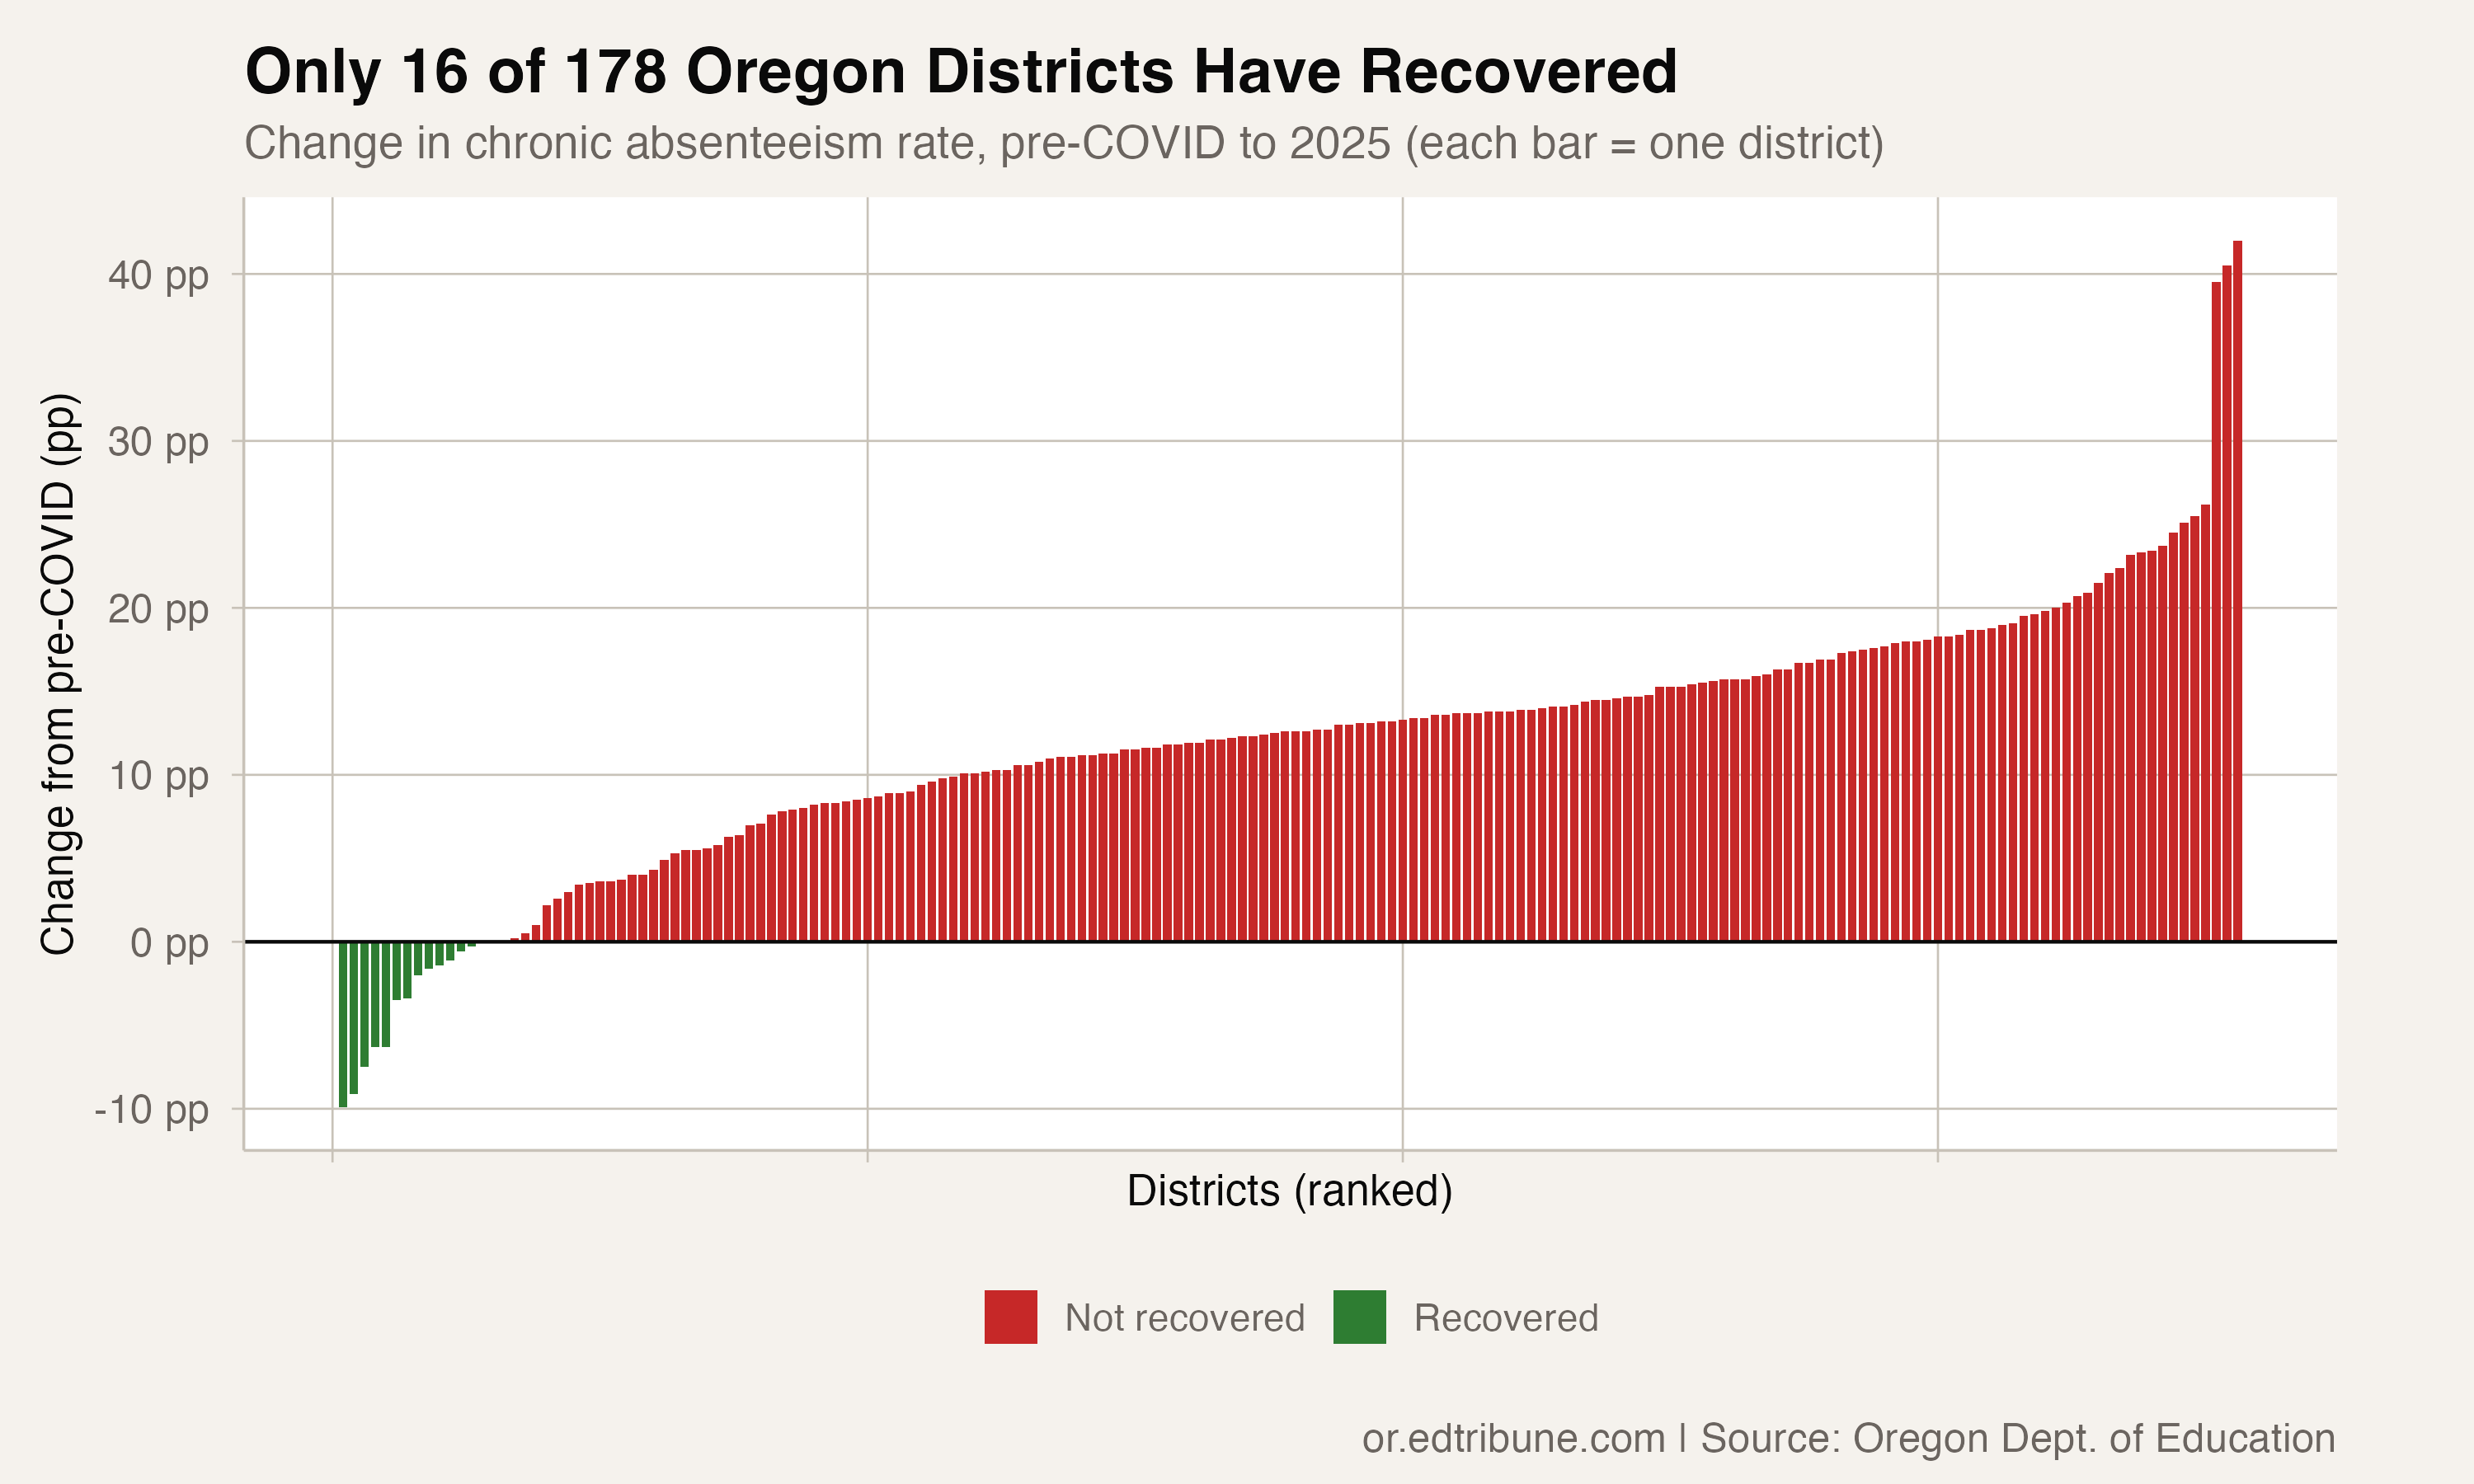
Brookings-Harbor is among just 14 districts in the entire state that can say the same. Out of 180 Oregon districts with comparable data on both sides of the pandemic, only 7.8% have returned to their pre-pandemic chronic absenteeism levels.
How these rates are measured
Every rate in this article comes from the school rows Oregon publishes, not from its district totals. The distinction matters because a district total counts students enrolled in district-sponsored online programs while the state suppresses those programs' own attendance rows, so the district figure can move without any student's attendance changing.
Marcola is the clearest case in the state. Its district row counts 919 students. Its two physical schools account for 264 of them, and the remaining 655 were enrolled in TEACH-NW, an online program whose attendance row the state stopped publishing in 2024-25. Nyssa's district row counts 2,185 students and leaves 1,095 of them unaccounted for by any published school row, a gap that opened after the district launched Nyssa Virtual School. Read off the district rows, Marcola comes in at 8.4% and Nyssa at 10.6%, which is what the earlier version of this article reported. In eight of the 180 districts here, more than a tenth of the students in the district row are unaccounted for by any published school row.
The districts that haven't
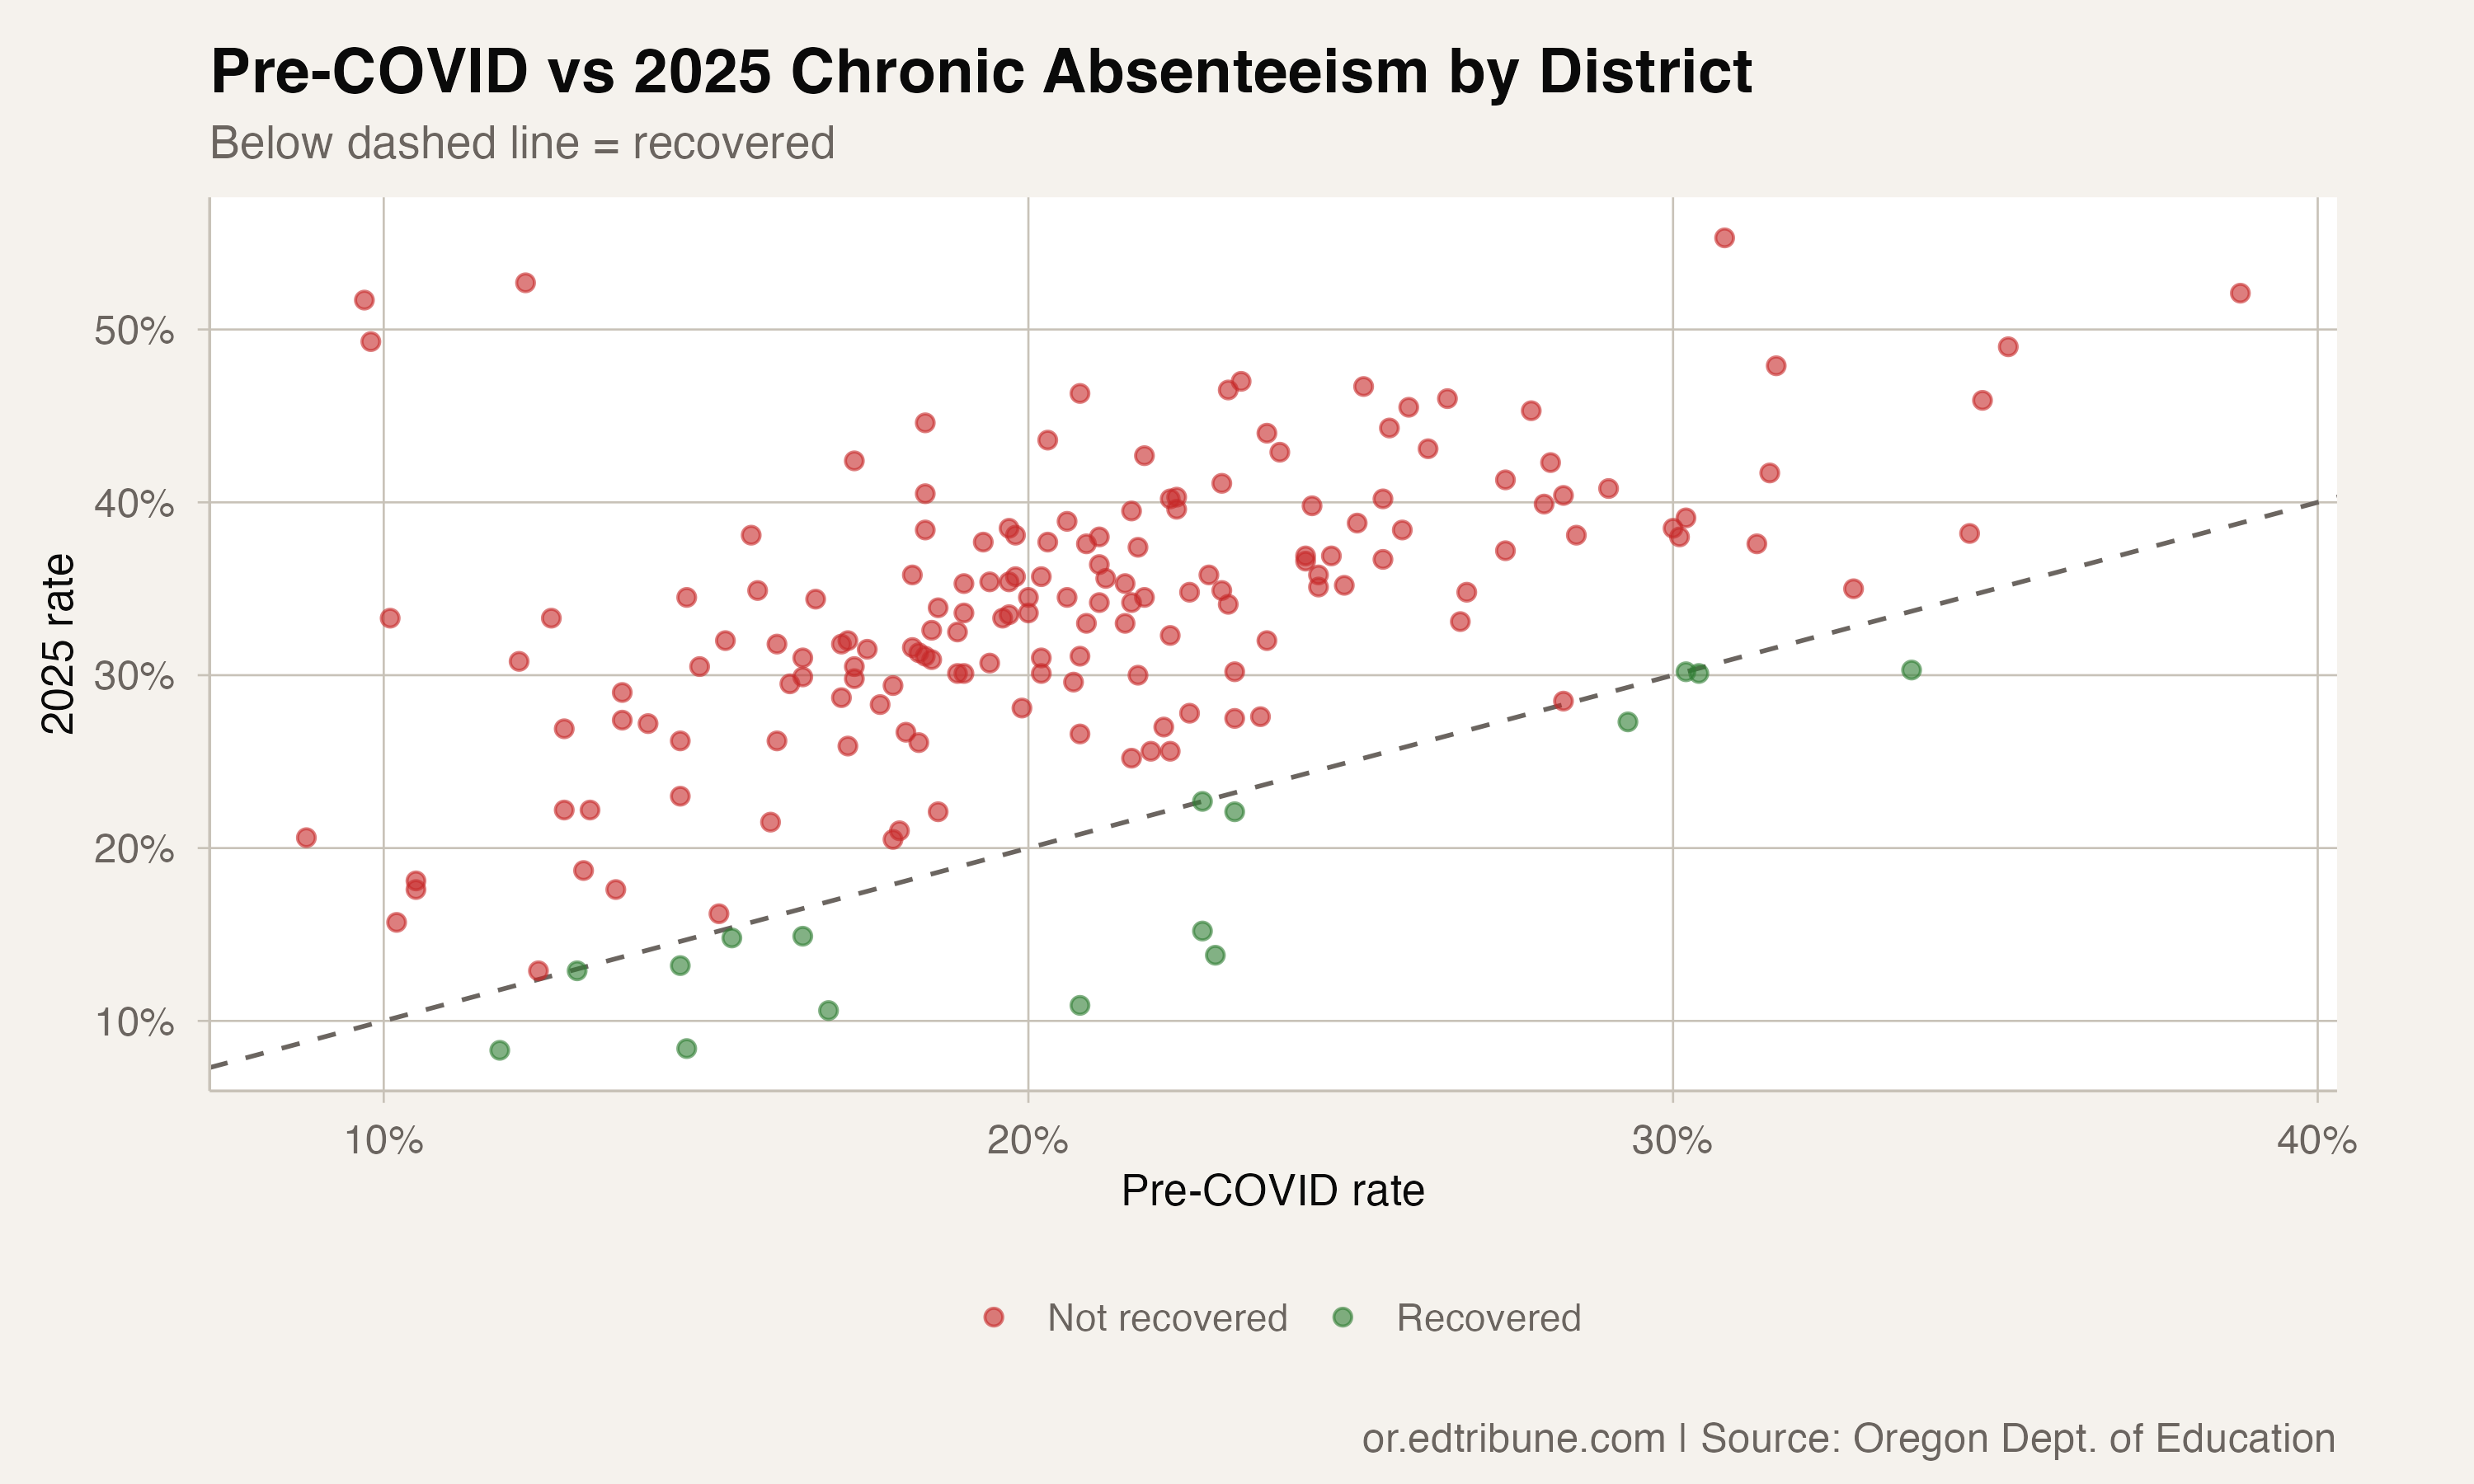
The median non-recovered district is 13.1 percentage points above its pre-COVID rate. That means about two-thirds of Oregon's districts have seen their chronic absenteeism rate rise by more than ten points since the pandemic, the equivalent of an additional one in ten students becoming chronically absent.
The worst gaps are staggering. Several small districts saw their rates double or triple. Among larger districts, the pattern is consistent: Salem-Keizer is 16.9 points above its 2019 rate. Beaverton is up 11.2 points. Hillsboro is up 14.5. North Clackamas is up 12.7. Portland is up 13.5 points.
The ten largest: all worse
None of Oregon's ten largest school districts have recovered their pre-pandemic attendance. Ranked by the students the state's attendance file counts, they are Portland (41,435), Beaverton (36,315), Salem-Keizer (35,987), Hillsboro (18,051), North Clackamas (16,351), Bend-La Pine (16,338), Eugene (15,253), Medford (13,139), Tigard-Tualatin (10,964), and Gresham-Barlow (10,842). Every one is worse than 2019.
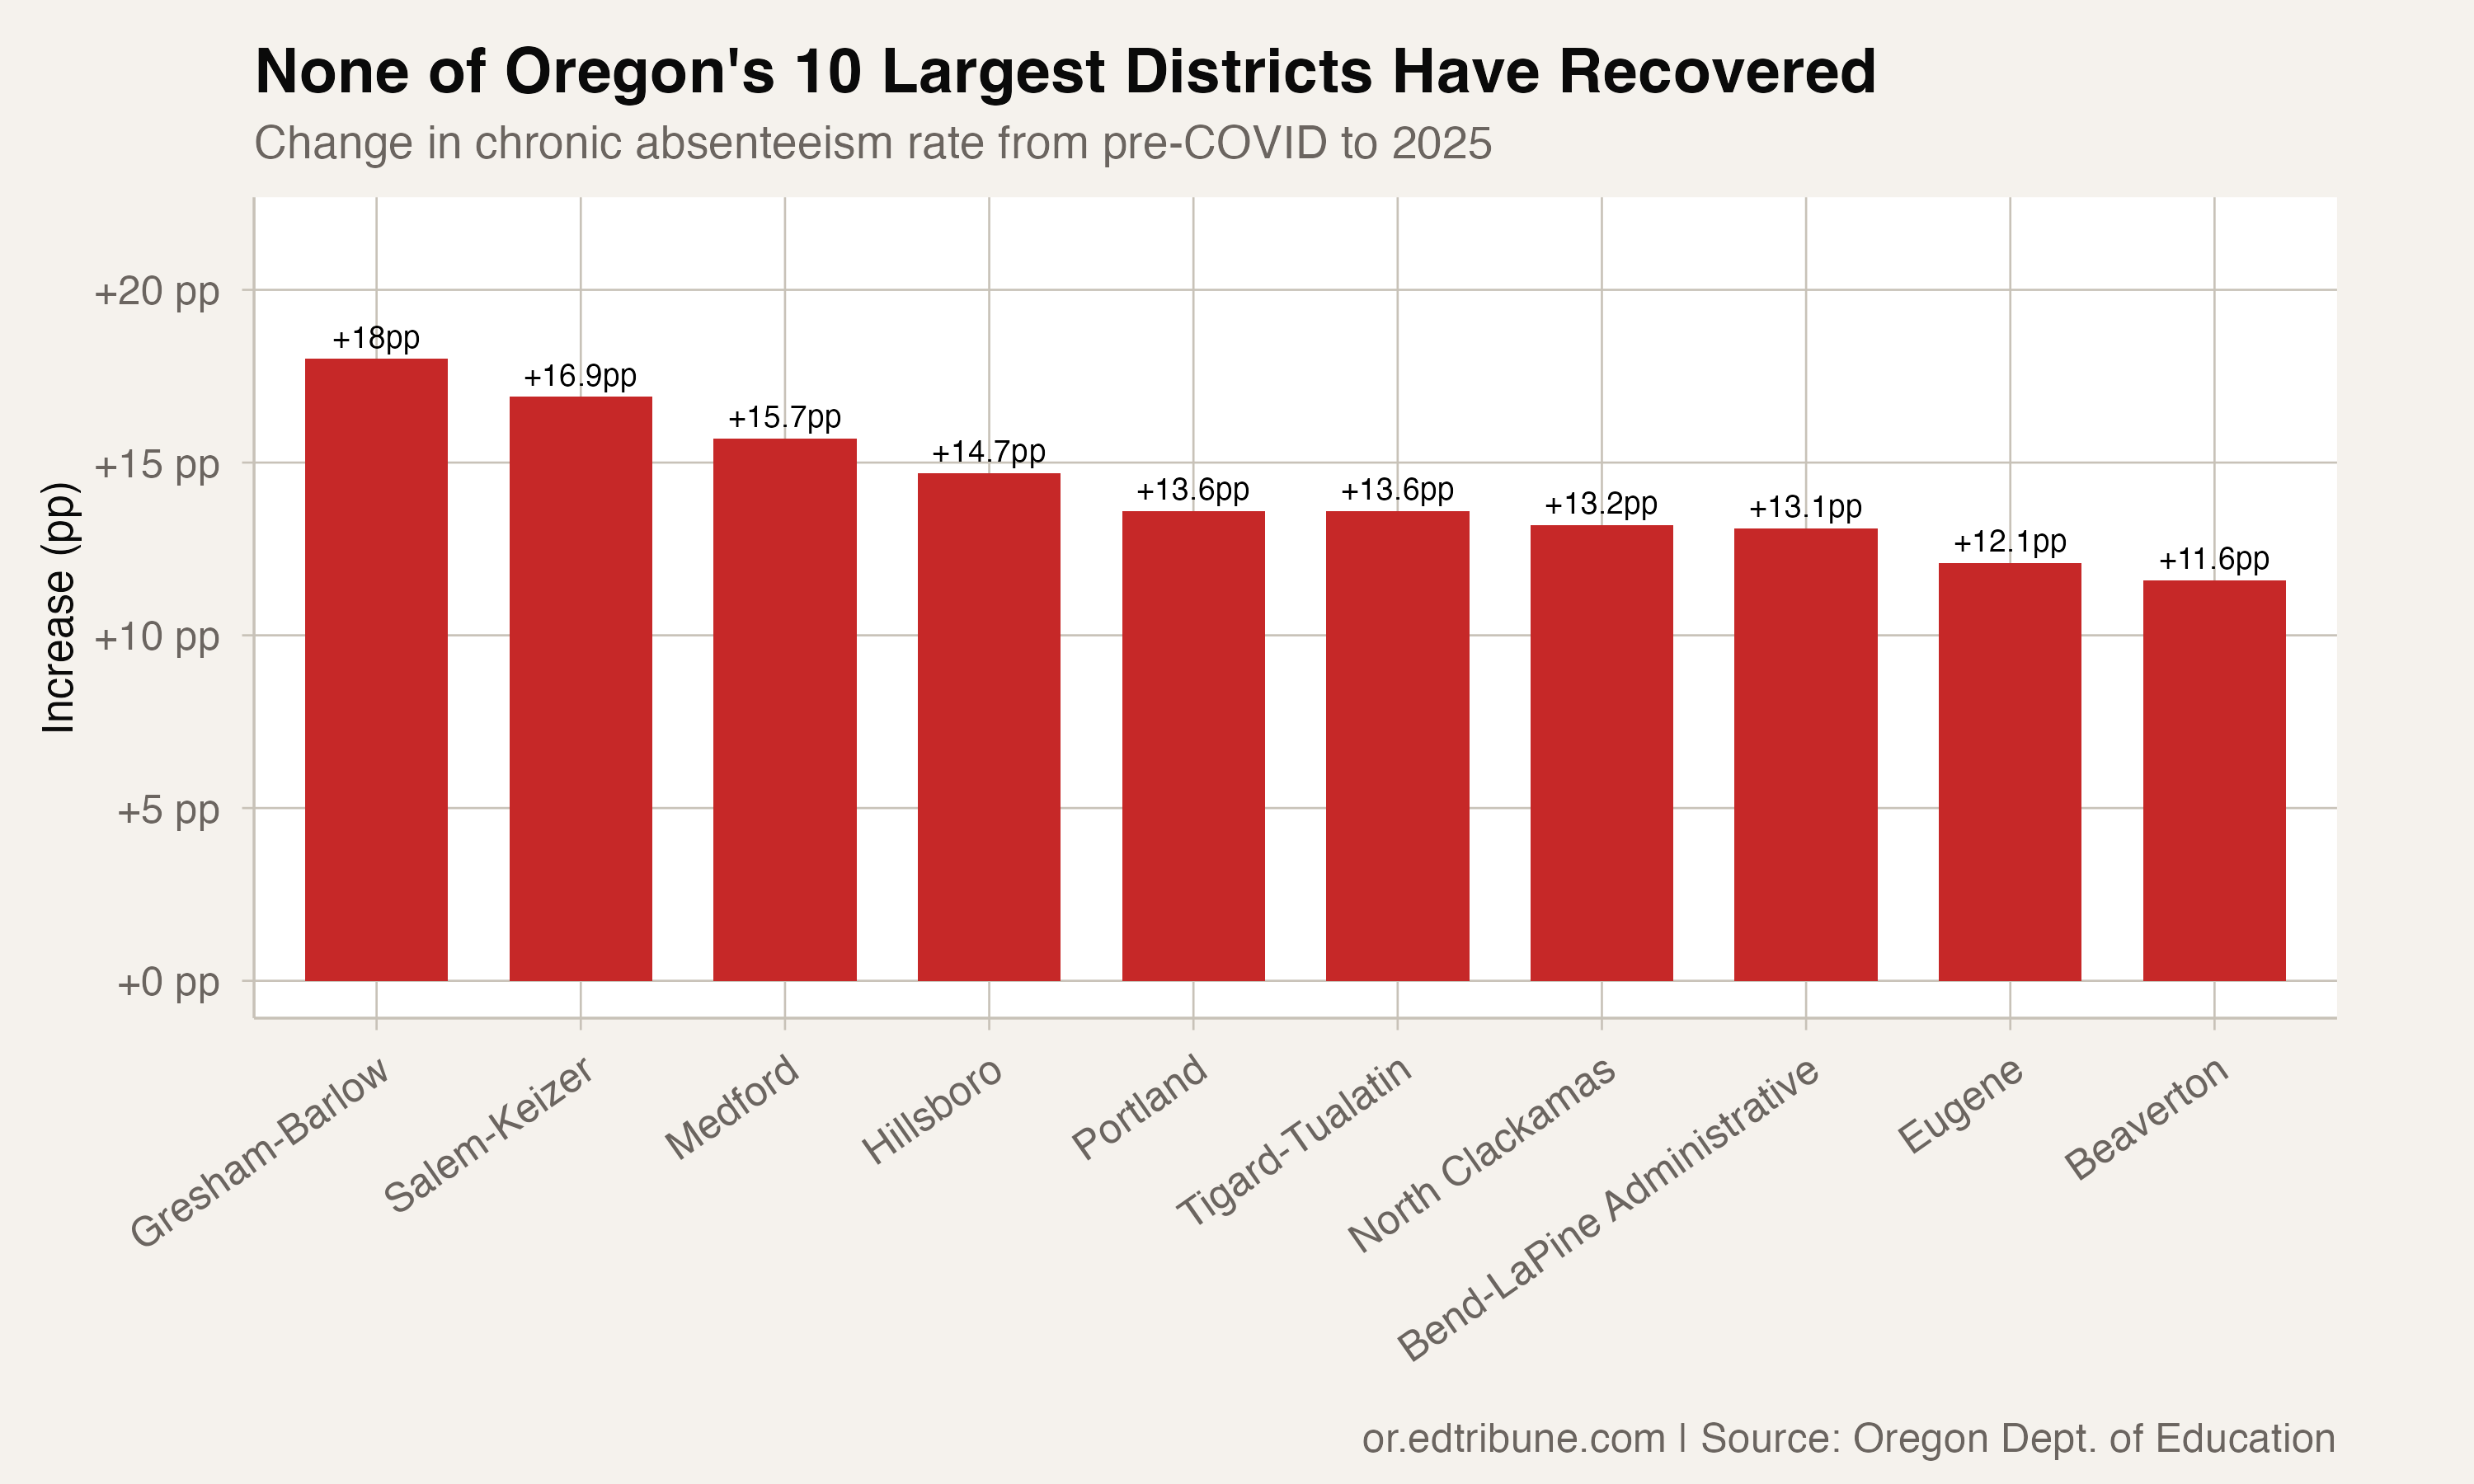
Beaverton, at 28.2% chronic absenteeism, is 11.2 points above its pre-COVID level of 17.0%. Portland's 31.8% represents a 13.5-point increase from its 2019 rate of 18.3%. Salem-Keizer's 42.6% is the highest of the ten, 16.9 points above its pre-pandemic 25.7%.
The large-district failure is the most consequential finding. These ten districts count 214,675 students in the state's attendance file, 41.3% of the state total. Their non-recovery drives the statewide number.
What the recovered districts share
The 14 recovered districts are all small and rural. The largest is Brookings-Harbor SD, whose published school rows covered 1,152 students in 2024-25, and the next largest is Vale SD at 803. This makes their recoveries both inspiring and limited in what they can teach the larger system. A district that size can deploy its attendance coordinator to every family. Portland cannot.
Several recovered districts had relatively high pre-COVID rates, meaning they had further to fall and a lower bar to clear. Brookings-Harbor's return to 27.0% is still well above the state's pre-COVID average. Recovery, in this context, is a return to a status quo that was itself a problem.
The single-digit rate that made Marcola↗ET look like Oregon's standout, 8.4%, does not survive contact with the school rows. Marcola Elementary School and Mohawk High School enrolled 264 students between them in 2024-25 and reported a combined chronic absenteeism rate of 21.2%, up from 17.8% in 2019. Marcola has not recovered. Neither has Nyssa, whose physical schools reported 18.3% against 16.9% before the pandemic.
The arithmetic of recovery
If 92.2% of districts have not recovered, and the statewide rate is improving at roughly a point per year, how long until recovery reaches the majority? The math depends on which districts improve and how fast. The statewide rate could continue dropping even as most individual districts remain above their baselines, if the largest districts are driving the aggregate improvement.
But the data so far suggests the opposite: the largest districts are among the furthest from recovery. Portland's 4.4-point improvement in 2025 is encouraging but still leaves a 13.5-point gap. Salem-Keizer has improved just 4.6 points from its peak. Beaverton got worse every year from 2016 through 2023 before a partial recovery in 2024.
At 7.8% recovered three years after the peak, Oregon's school attendance crisis is not resolving district by district. It is resolving (slowly, unevenly) at the aggregate level, while the individual district landscape remains overwhelmingly worse than it was.
Detailed code that reproduces the analysis and figures in this article is available exclusively to EdTribune subscribers.
Discussion
Sign in to join the discussion.
Loading comments...