In this series: Oregon Chronic Absenteeism.
Beaverton School District↗ET had a 13.2% chronic absenteeism rate in 2014-15. The next year: 14.1%. Then 14.6%. Then 15.4%. Then 17.1%. Then the pandemic gap, and rates jumped to 27.2% in 2022 and 33.1% in 2023.
Six consecutive measurable transitions, each one worse than the last. The rate more than doubled in a district that enrolls 36,315 students and sits in one of the wealthiest suburbs in Oregon.
Beaverton is one of 12 Oregon districts with at least 500 students that got worse in every single measurable year from 2016 through 2023. The list includes Portland↗ET, Tigard-Tualatin↗ET, and North Clackamas↗ET, a cluster of Portland-area suburban systems that defied the expectation that affluent communities would be spared.
The list
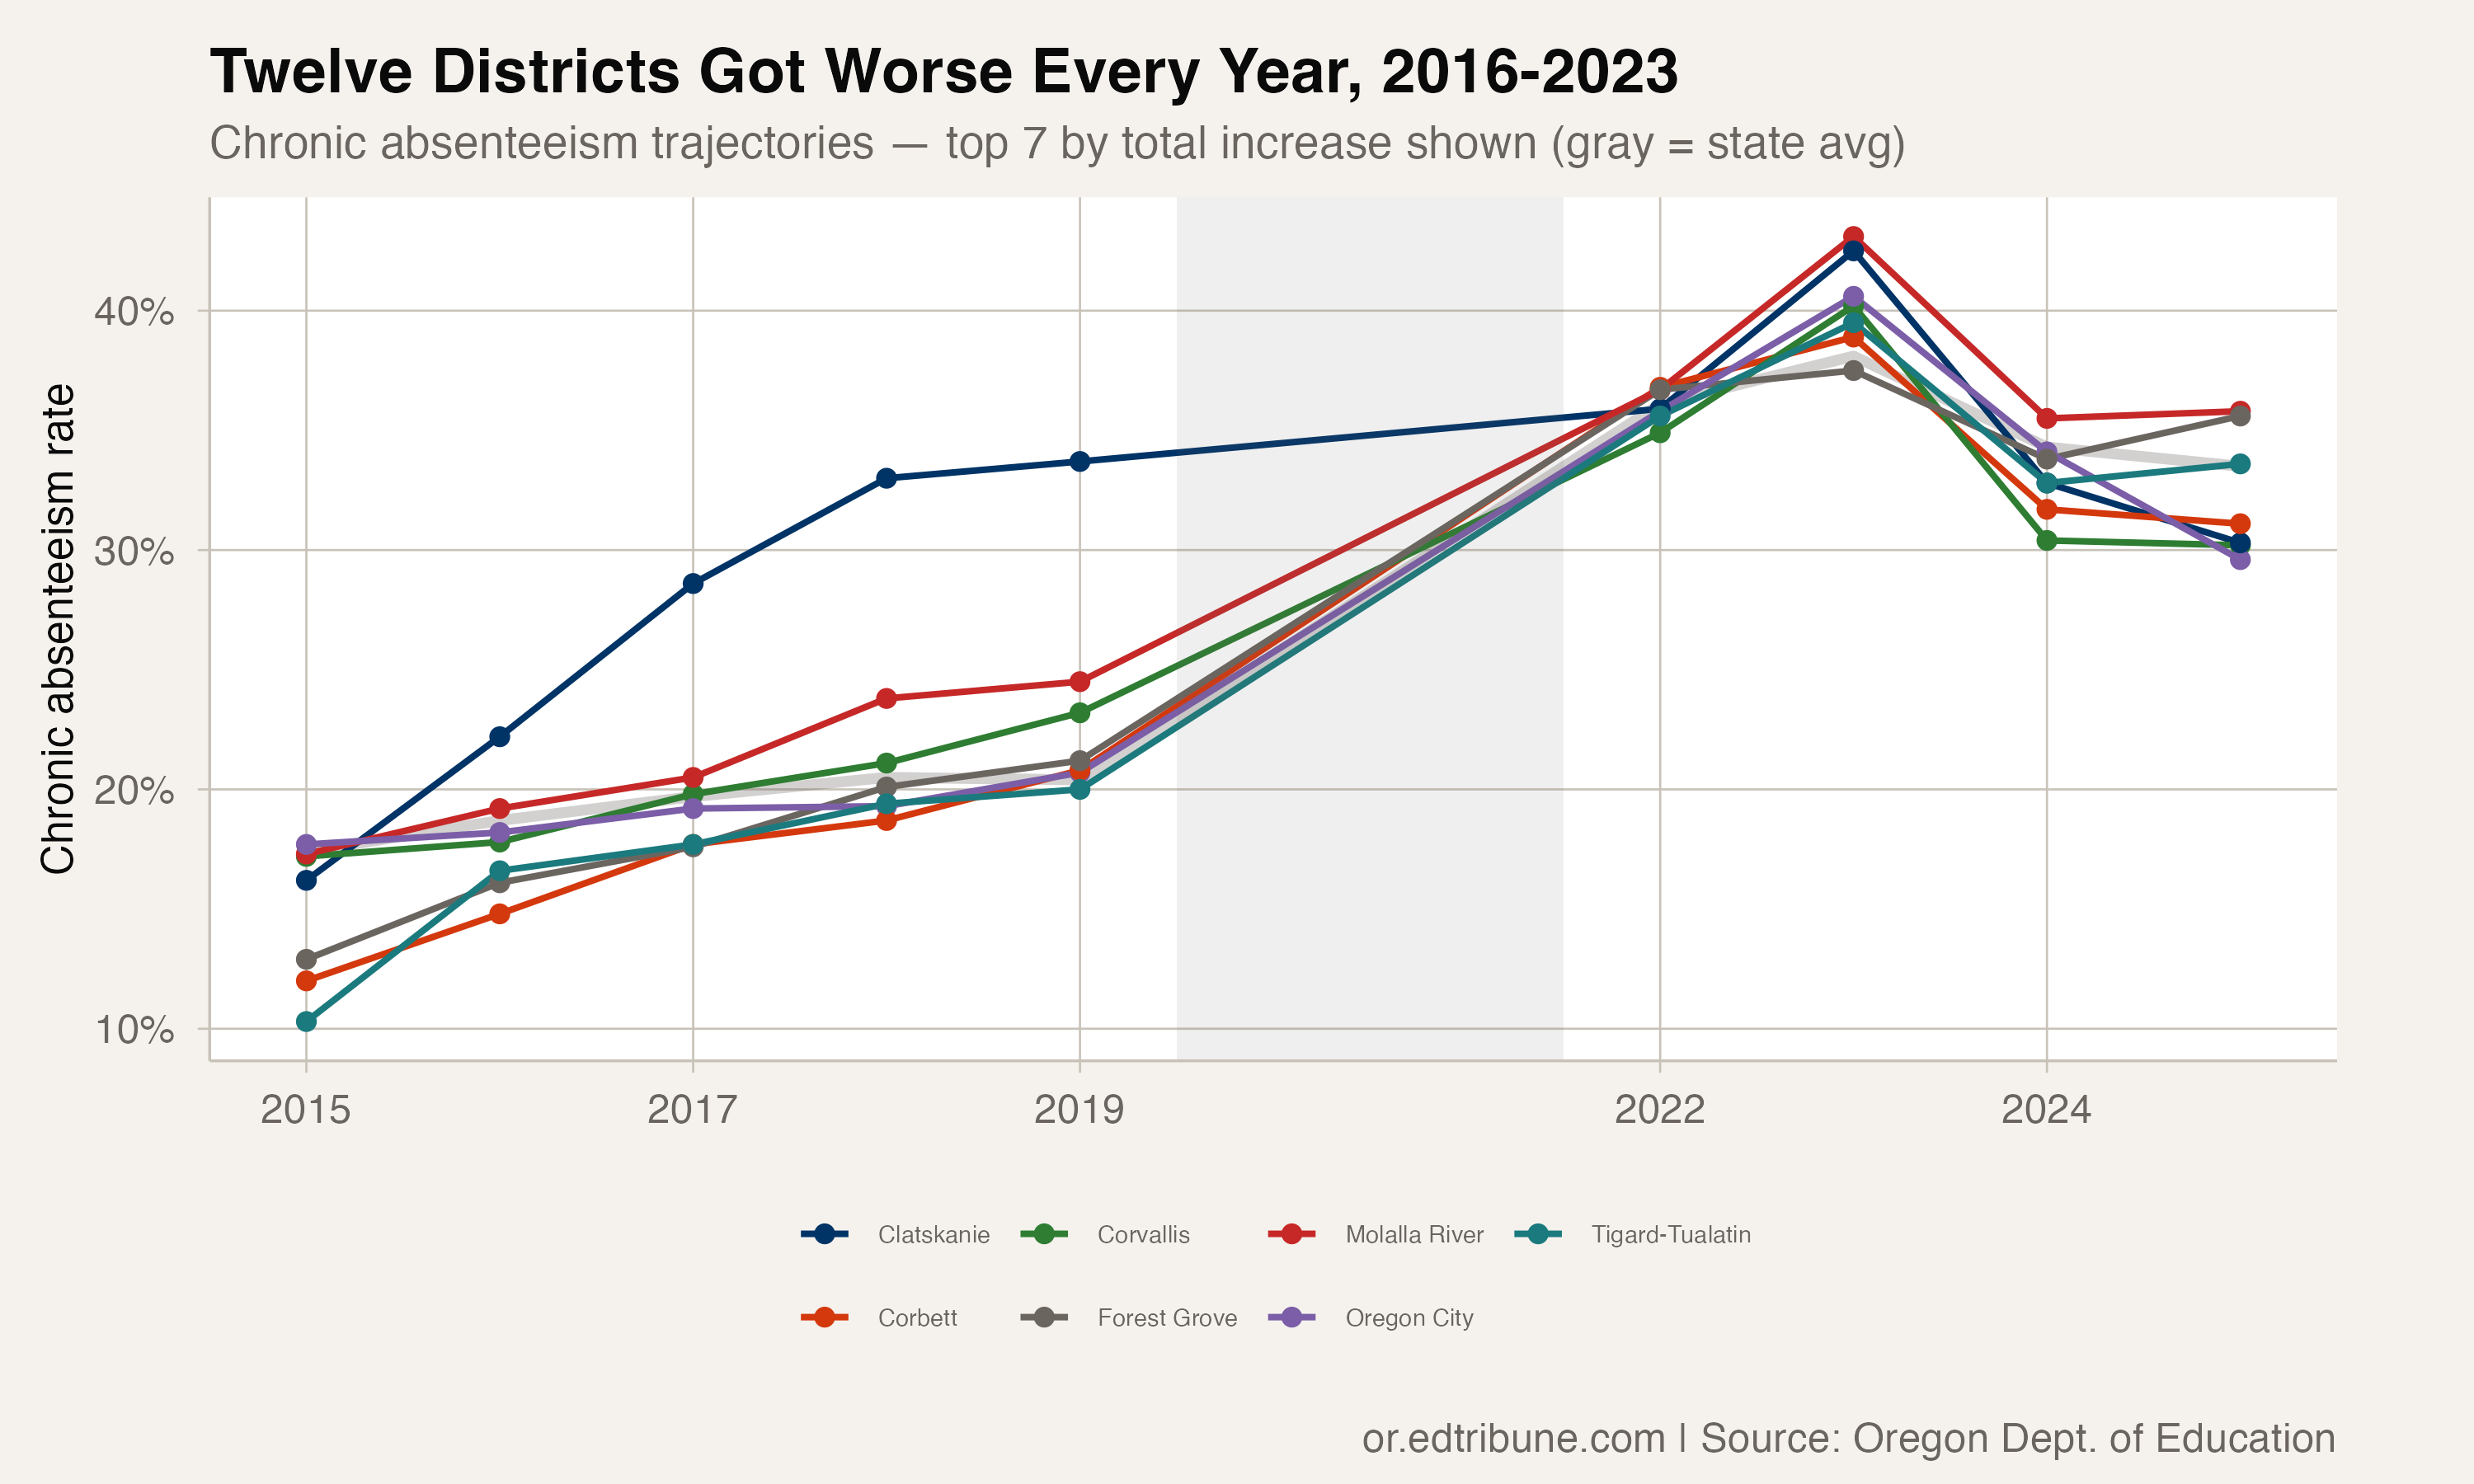
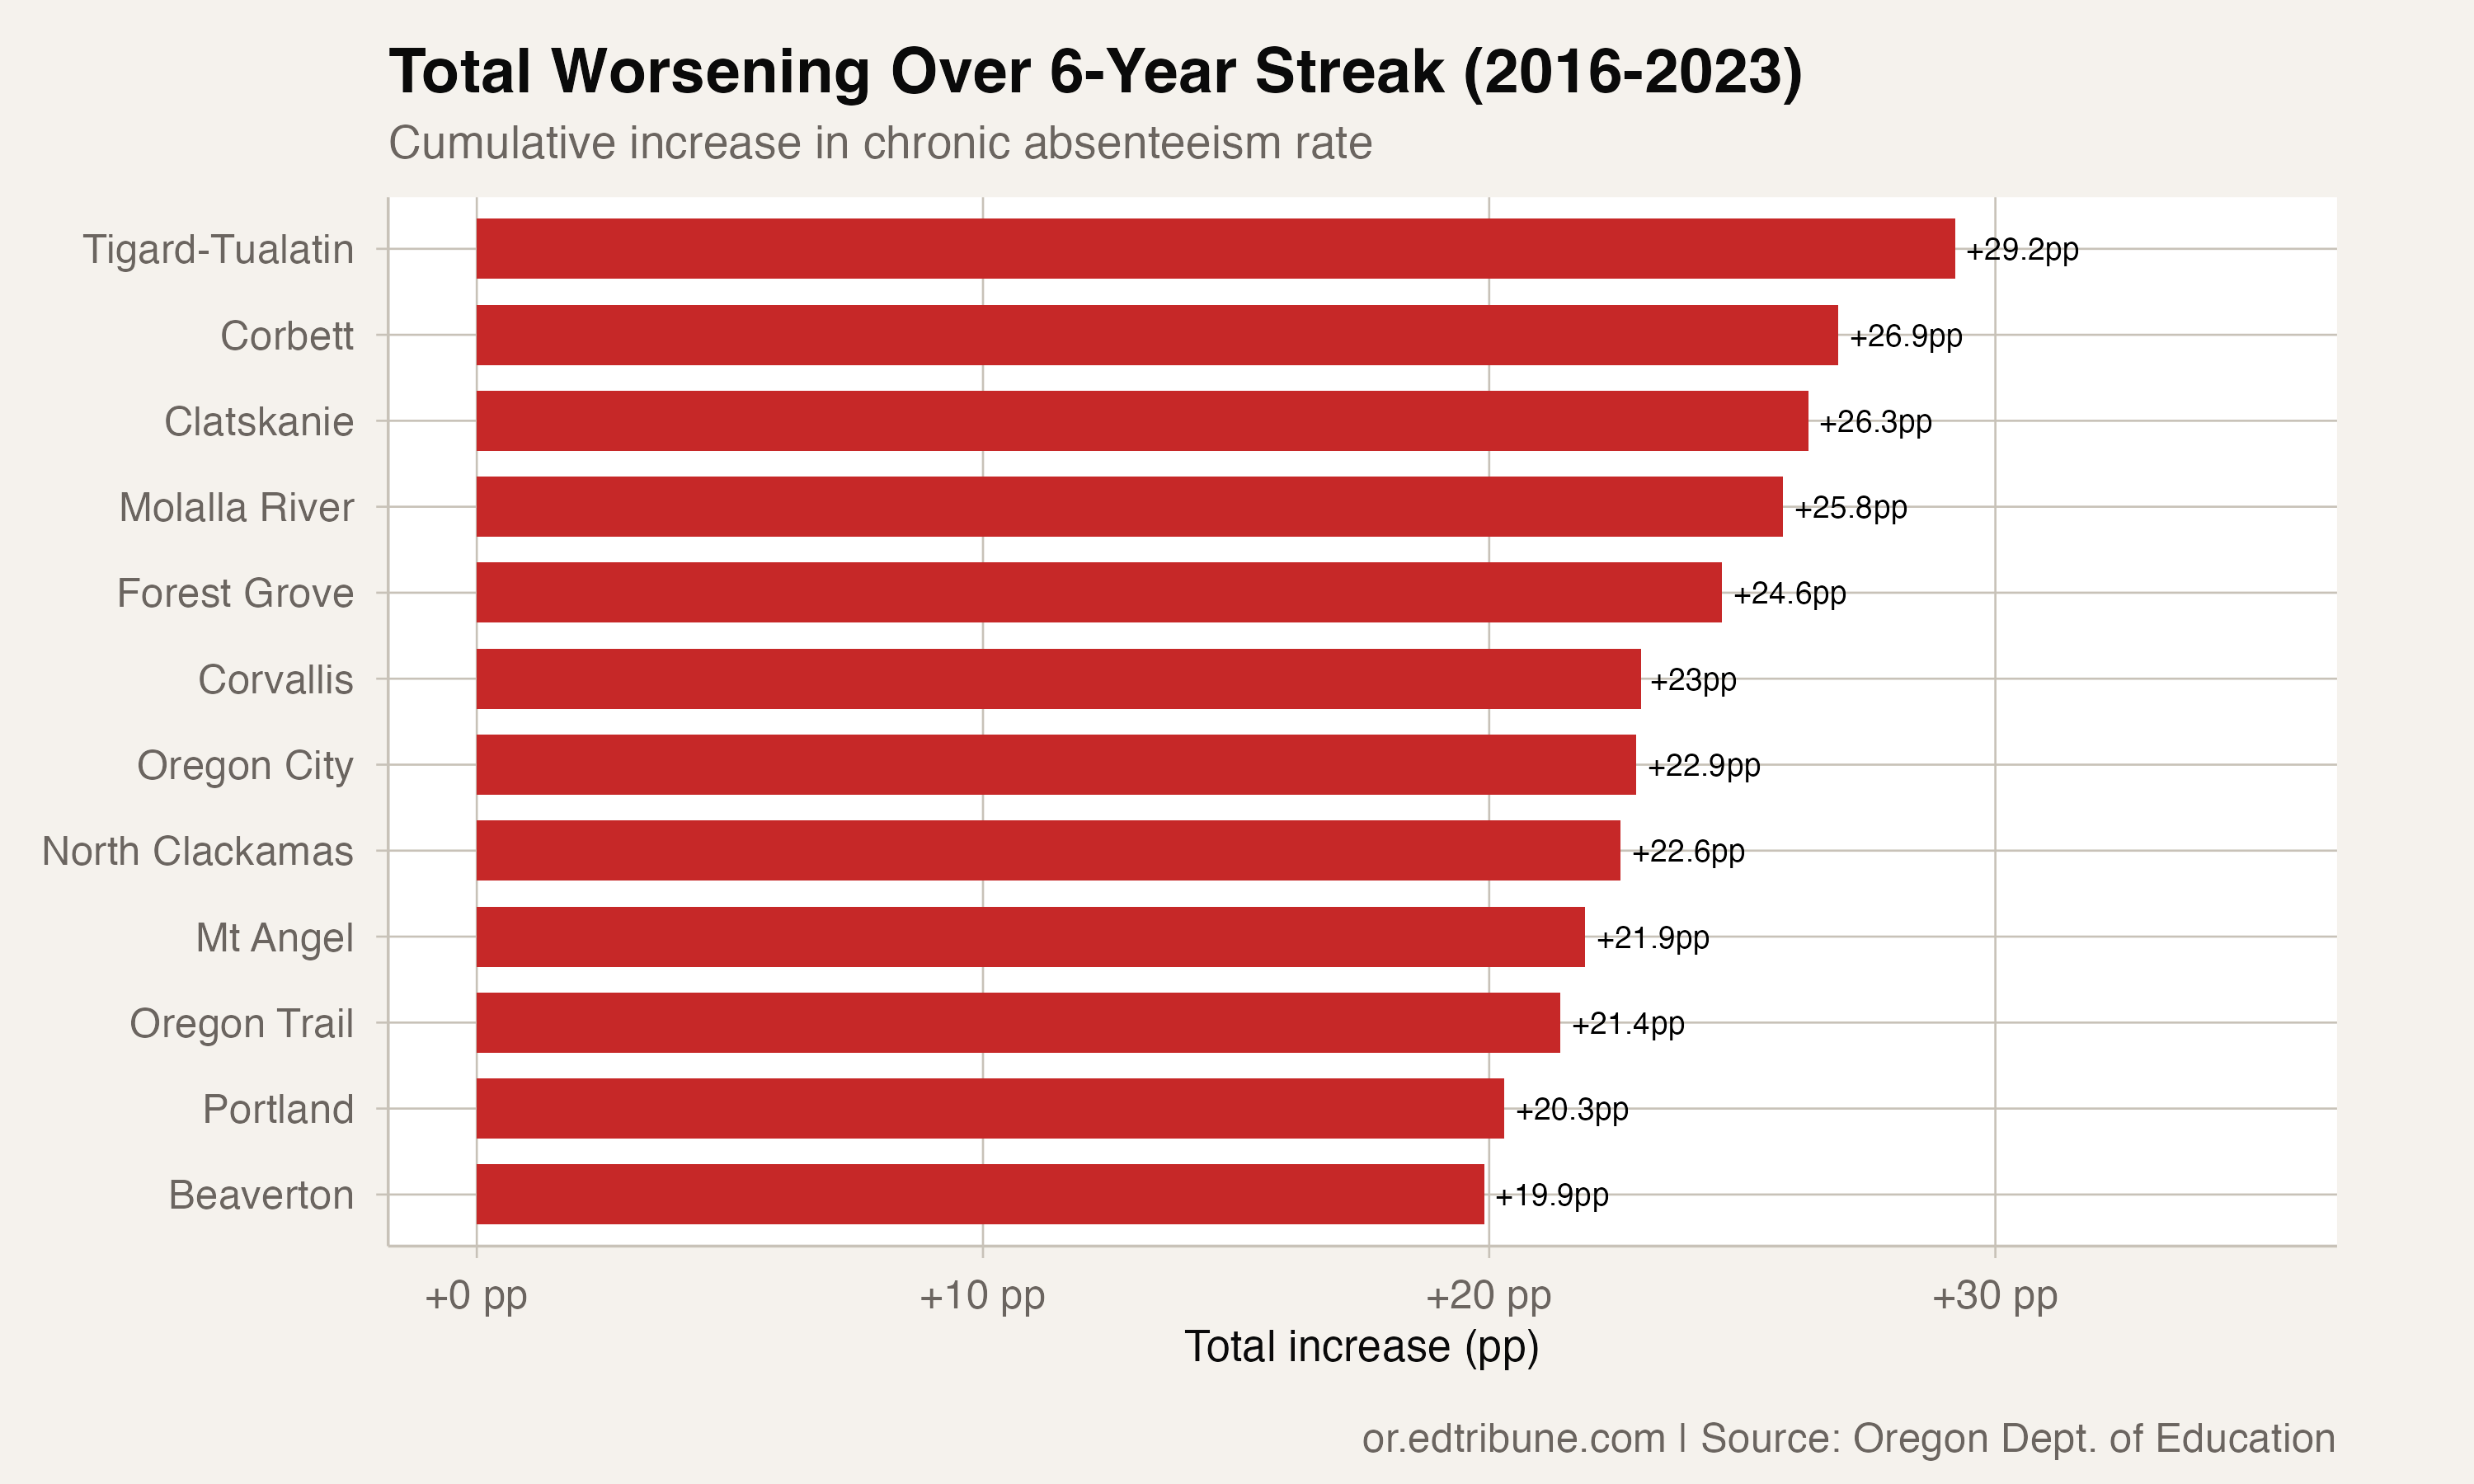
Twelve districts worsened in every measurable year from 2016 to 2023, six straight transitions spanning pre-pandemic, pandemic, and post-pandemic eras:
Tigard-Tualatin↗ET saw the steepest increase: +29.2 percentage points over the streak, from 10.3% to 39.5%. Corbett↗ET rose from 12.0% to 38.9% (+26.9pp). Clatskanie↗ET from 16.2% to 42.5% (+26.3pp). Molalla River↗ET from 17.3% to 43.1% (+25.8pp). Forest Grove↗ET from 12.9% to 37.5% (+24.6pp). Corvallis↗ET from 17.2% to 40.2% (+23.0pp). Oregon City↗ET from 17.7% to 40.6% (+22.9pp). North Clackamas↗ET from 13.1% to 35.7% (+22.6pp). Mt Angel↗ET from 16.4% to 38.3% (+21.9pp). Oregon Trail↗ET from 17.6% to 39.0% (+21.4pp). Portland↗ET from 16.1% to 36.4% (+20.3pp). Beaverton↗ET from 13.2% to 33.1% (+19.9pp).
Then 2024 happened
Eleven of these 12 districts improved in 2024. Beaverton dropped from 33.1% to 28.3%. Corvallis fell from 40.2% to 30.4%. Mt Angel had the largest decline, from 38.3% to 23.6%. The streaks broke nearly in unison, suggesting a systemic shift, perhaps the cumulative effect of state and district attendance campaigns rather than random variation. Portland was the lone holdout, edging up slightly from 36.4% to 36.9% in 2024 before falling to 32.5% in 2025.
But the improvement was uneven. Several districts barely budged. And in 2025, some started backsliding again. Forest Grove worsened from 33.8% to 35.6%. Molalla from 35.5% to 35.8%. North Clackamas from 30.1% to 30.5%.
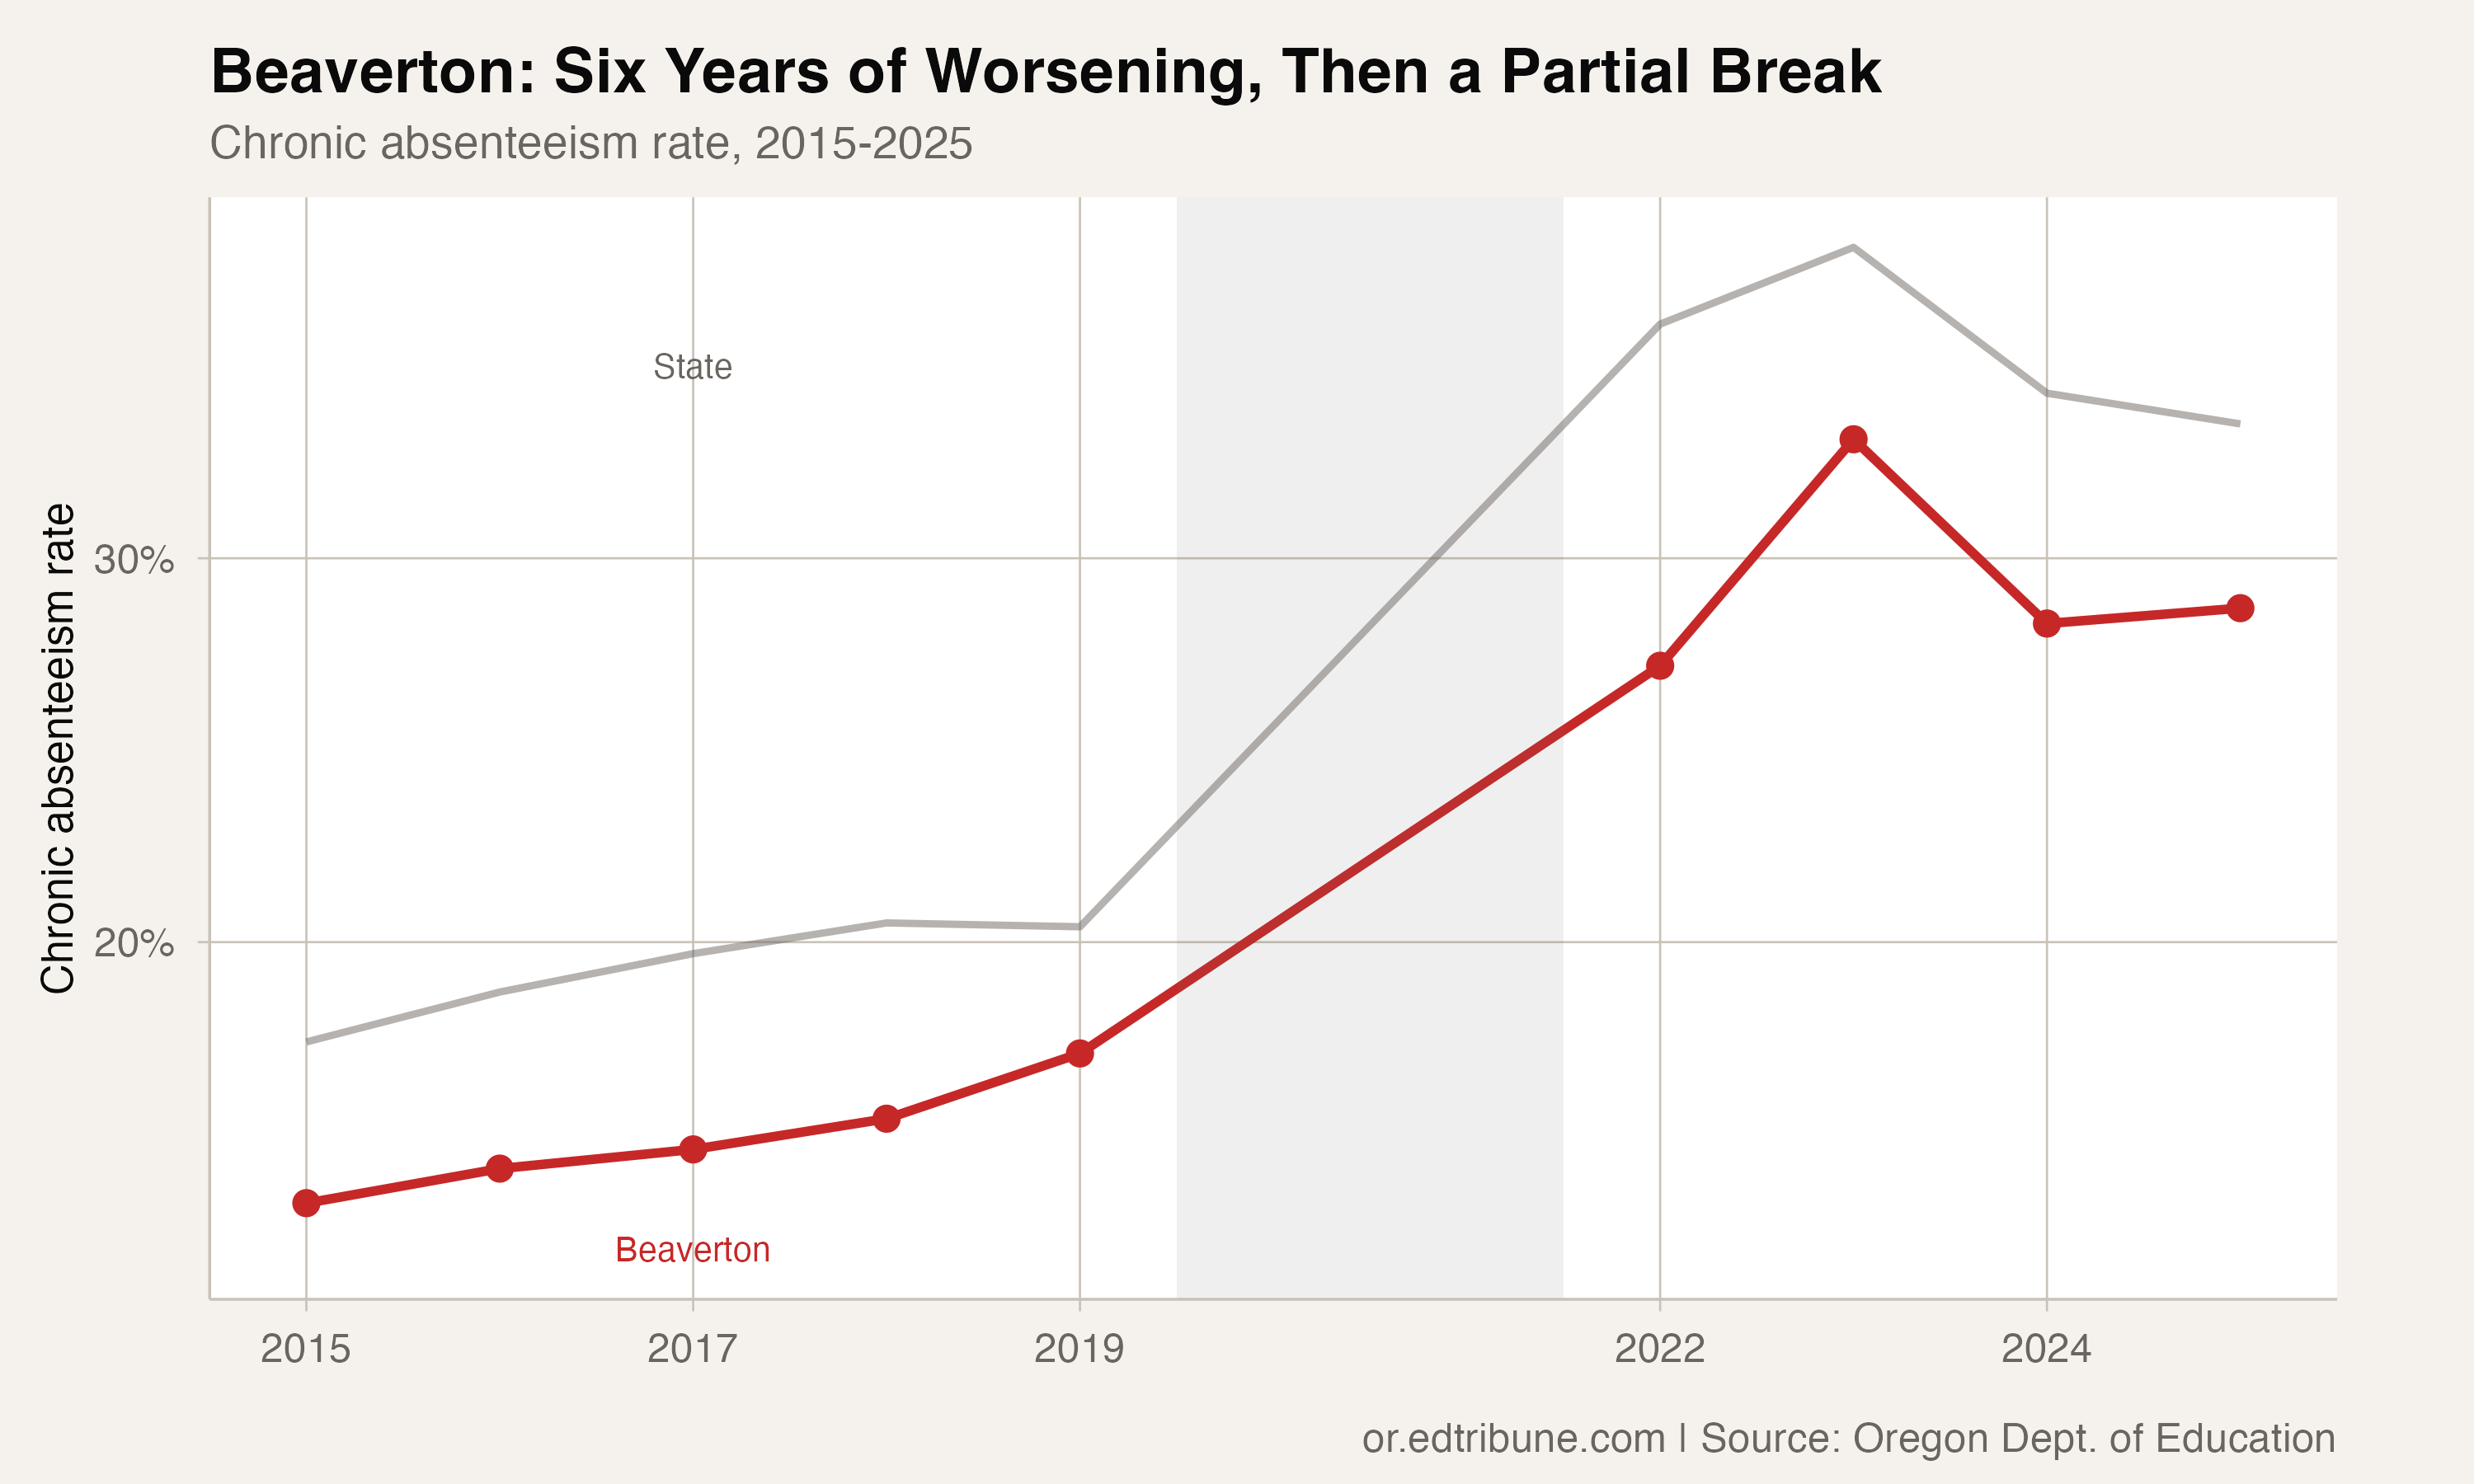
Beaverton's 28.7% in 2025 was essentially flat after its 2024 improvement, still more than double its 2015 starting point of 13.2%. The six-year streak may have ended, but the damage it left behind has barely begun to reverse.
The suburban paradox
Five of the 12 (Beaverton, North Clackamas, Tigard-Tualatin, Oregon City, and Portland) are Portland-metro districts. These are not the communities that typically appear in attendance crisis narratives. They have higher median incomes, lower poverty rates, and more school resources than rural districts. And yet their attendance trajectories were among the worst in the state for six straight years.
Beaverton's 28.7% rate means that in a district where Nike is headquartered and the median household income exceeds $80,000, more than one in four students is chronically absent. The explanation cannot be poverty alone. Something about the suburban experience in the Portland metro (commuting patterns, two-income families, the normalization of flexible schedules) eroded attendance in ways that predated the pandemic and accelerated through it.
Not a COVID story
The six-year streak is the crucial detail. These districts were getting worse before COVID-19 existed. The pandemic accelerated the trend but did not cause it. A district that worsened in 2017, 2018, and 2019, when schools were fully open and the economy was strong, is experiencing something structural, not cyclical.
The pre-pandemic worsening suggests that chronic absenteeism may be responding to cultural shifts that are independent of school policy: rising mental health challenges among students, and a gradual erosion of the norm that daily attendance is non-negotiable.
The math of years lost
These 12 districts collectively enroll about 135,000 students. Their six-year deterioration means the number of chronically absent students in these districts more than doubled, from about 23,000 in 2016 to about 49,000 at the 2023 peak. The 2024 improvements brought that down, but most remain far above where they started.
The statewide rate dropped 4.6 points from its 2023 peak to 33.5% in 2025. The streaks finally broke. But most of the districts that worsened for six straight years are still 5 to 15 points above their 2019 levels. The streak ending was the first good news. The question is whether 2024 was a turning point or a pause.
Detailed code that reproduces the analysis and figures in this article is available exclusively to EdTribune subscribers.
Discussion
Sign in to join the discussion.
Loading comments...