In this series: Oregon Chronic Absenteeism.
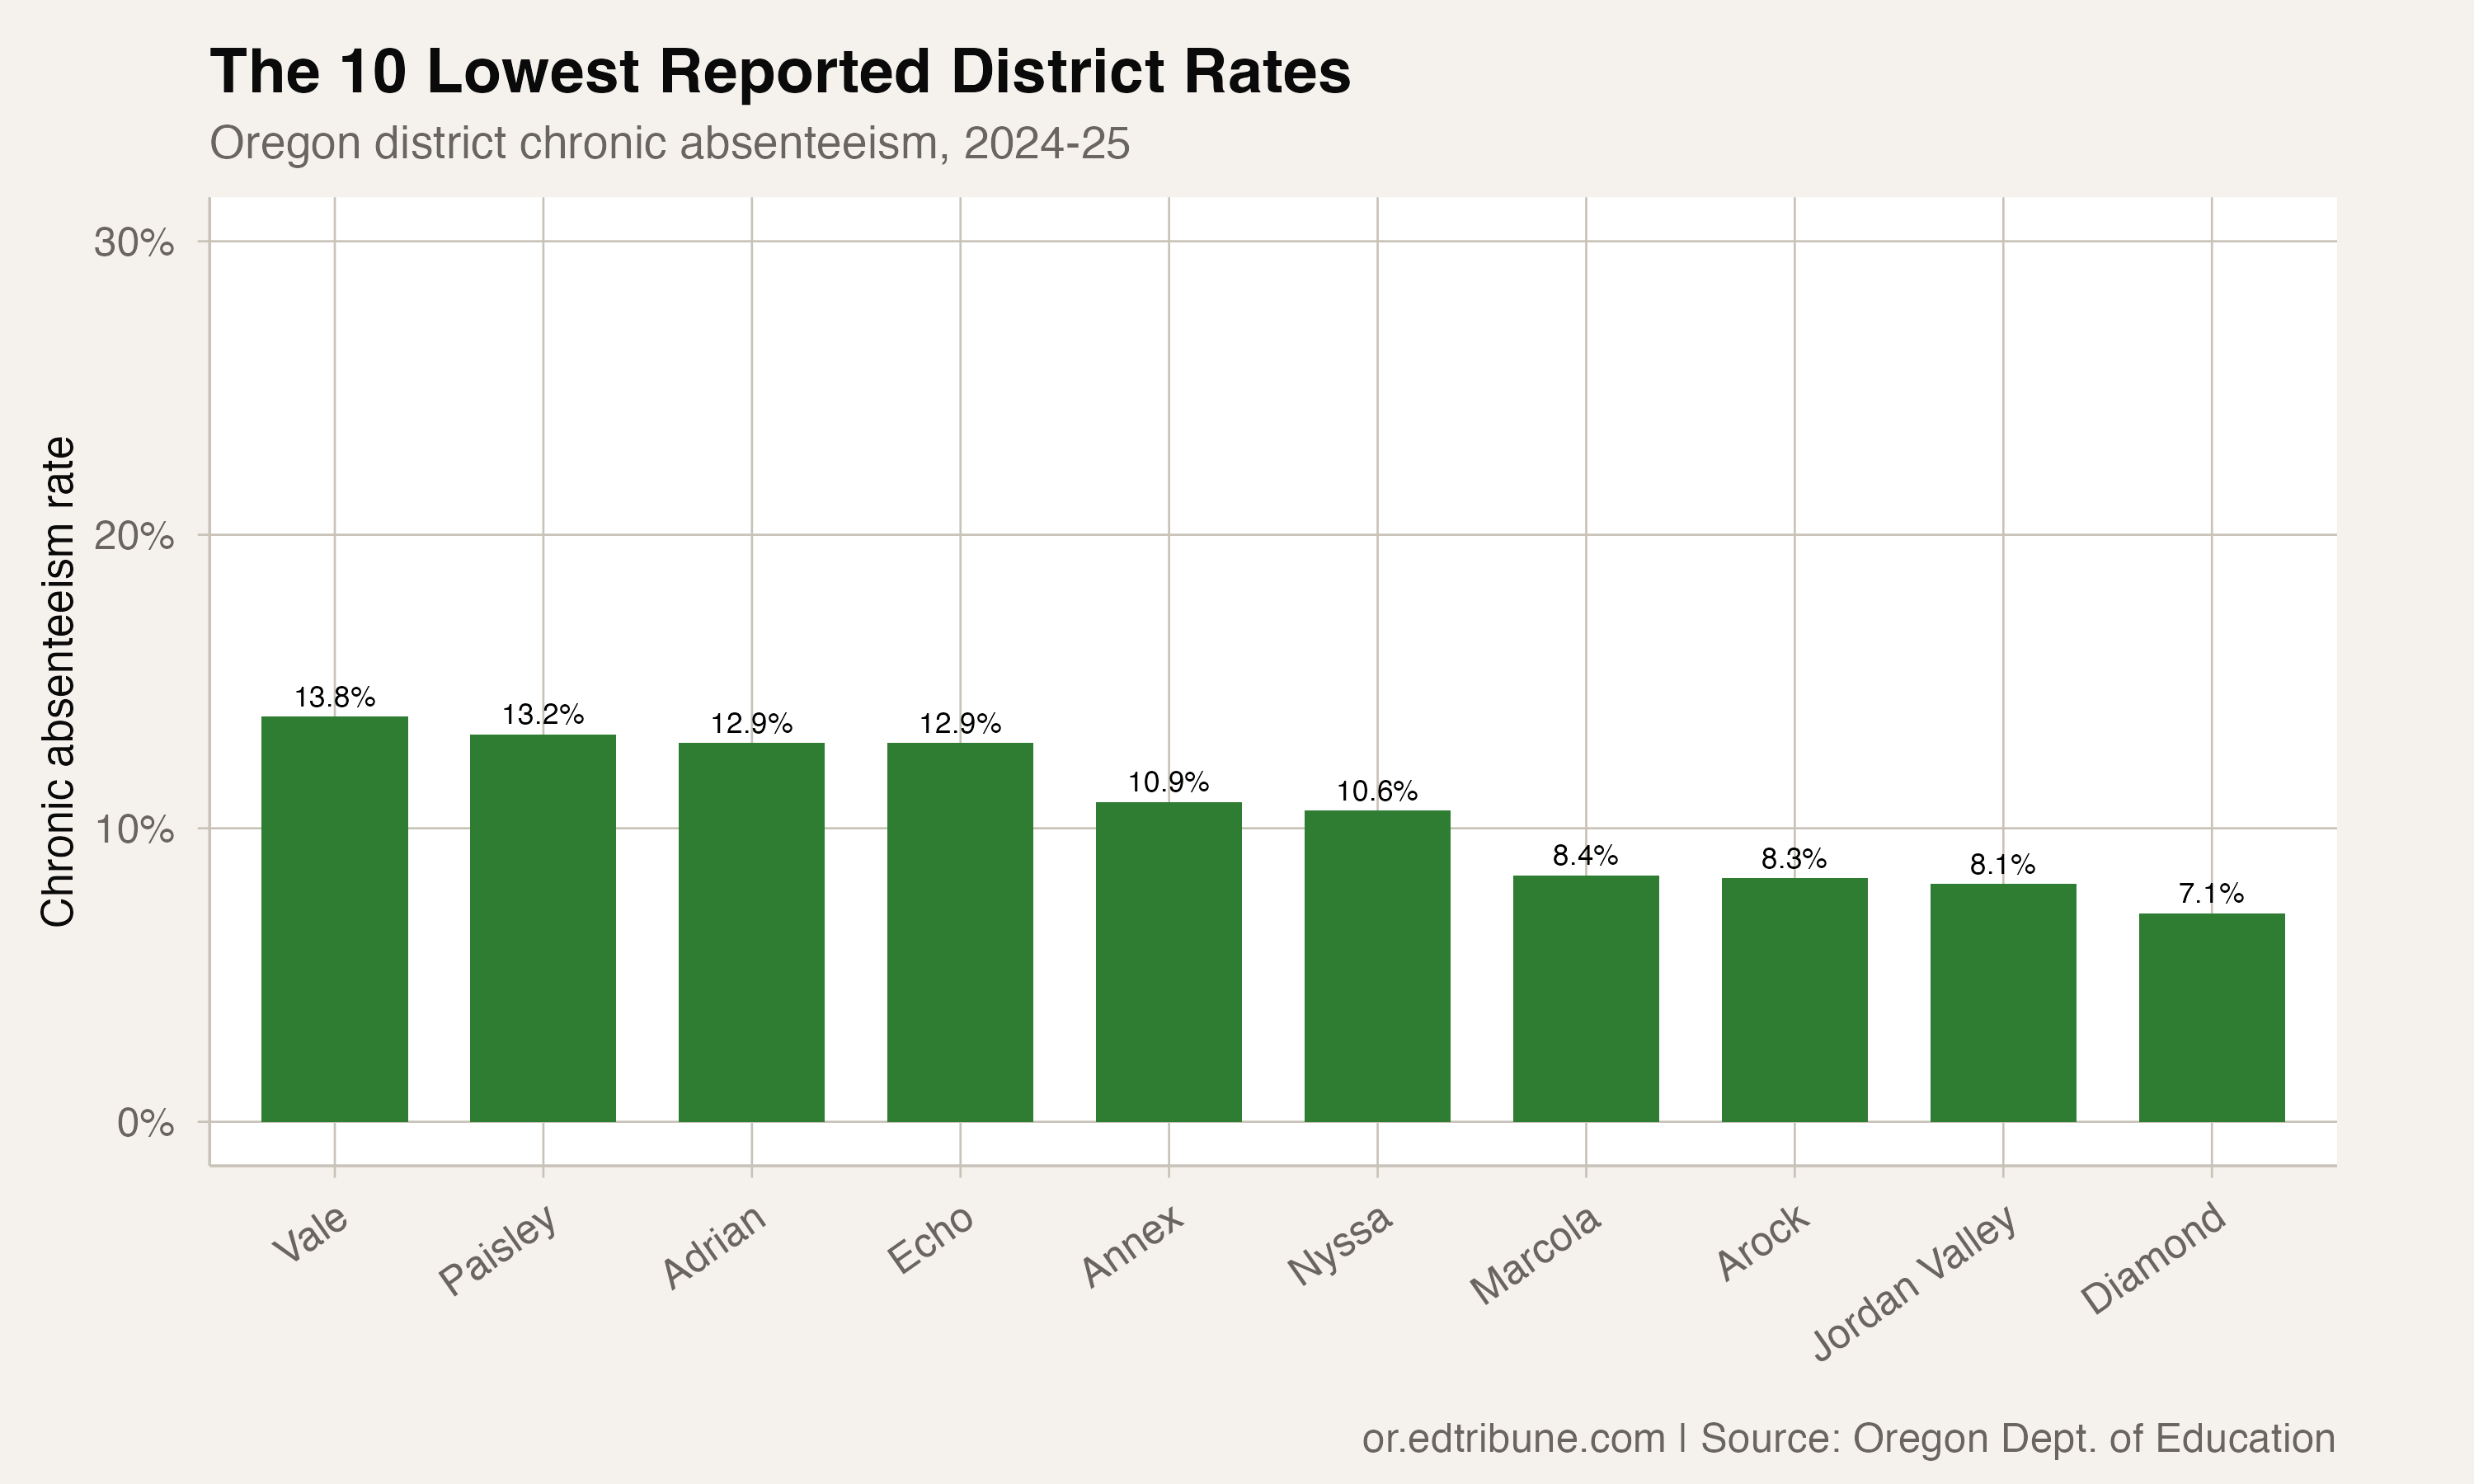
Correction (September 5, 2026): An earlier version of this article reported that thirty Oregon districts had chronic absenteeism rates below 25%, and its chart of the lowest rates ranked Marcola SD 79J↗ET at 8.4% and Nyssa SD 26↗ET at 10.6%. Those two district rates count large numbers of students whose own school attendance rows the state does not publish. Measured on the schools each district does report, Marcola is at 21.2% and Nyssa at 18.3%, and the count of districts below 25% is 28 rather than 30. The chart now ranks districts on that basis, and a new section explains what a district row counts. The article's central finding is unchanged: 154 of 184 districts were at or above 25% on the state's district rows, and 156 were on the school-reported basis.
Oregon considers students chronically absent when they miss at least 10% of enrolled school days, including excused absences, according to the Oregon Department of Education. A district rate of 25% means one in four students meets that definition.
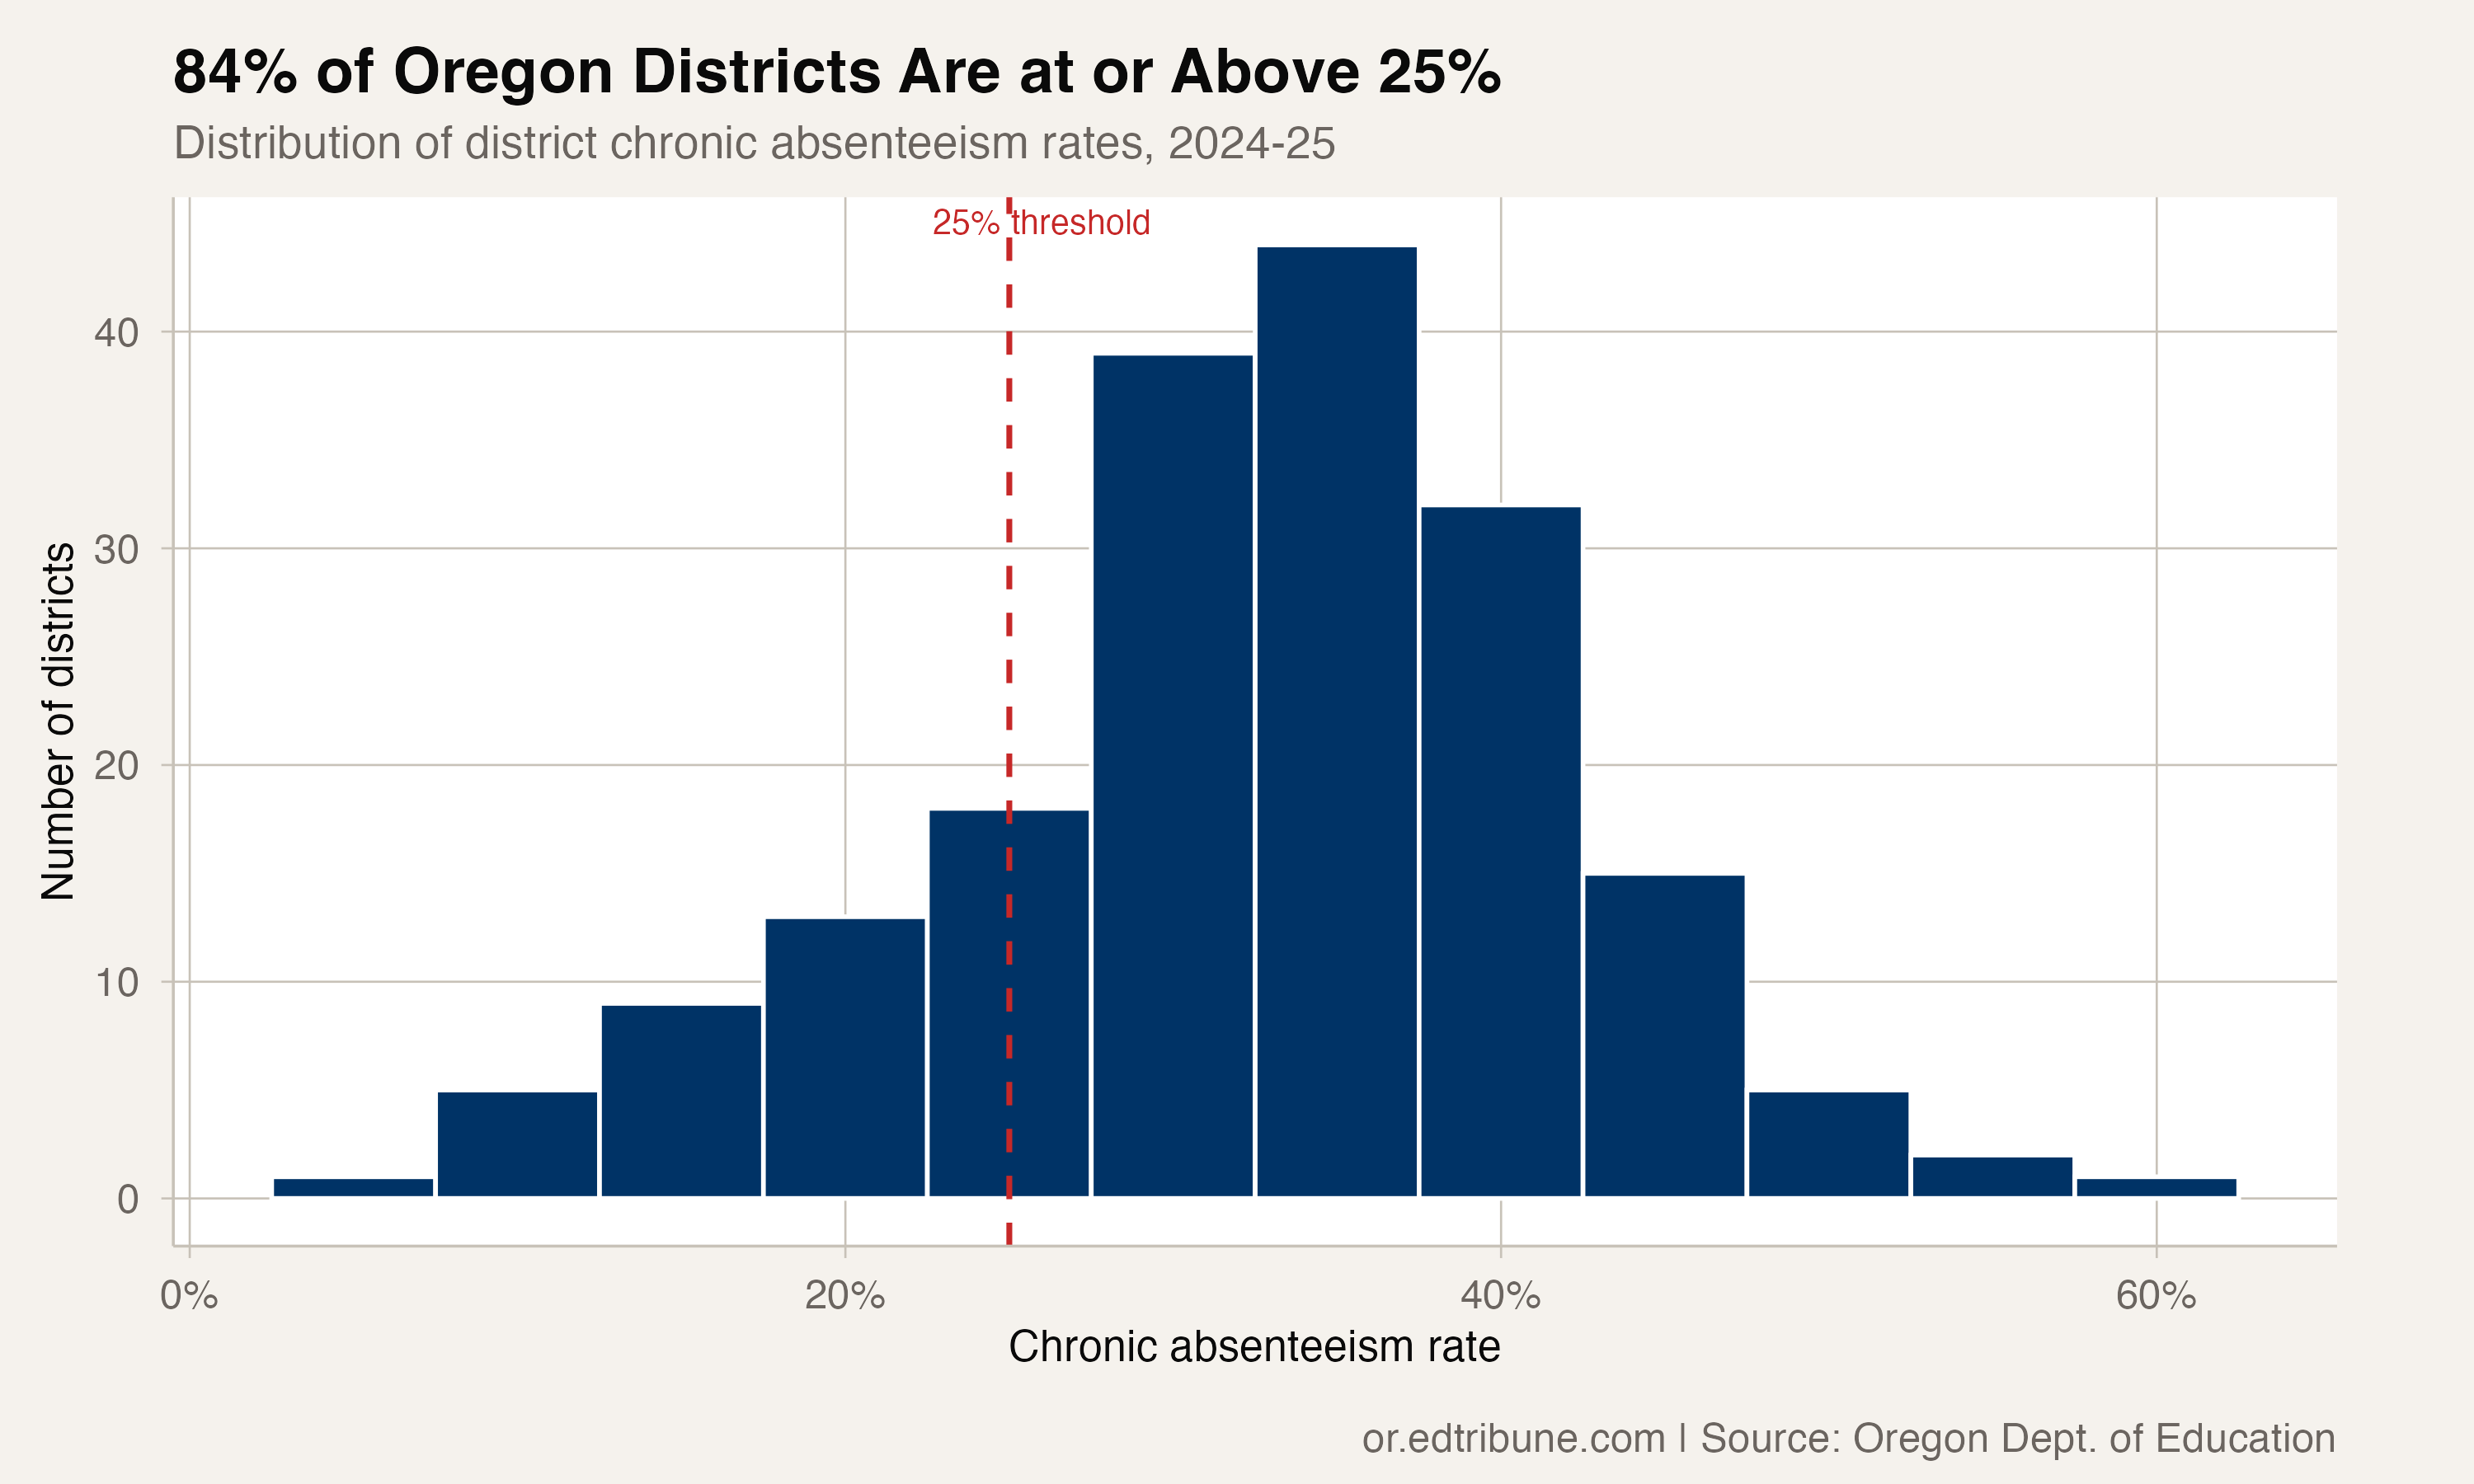
Of 184 Oregon districts reporting chronic absenteeism data in 2024-25, 154, or 83.7%, had rates at or above 25%. More than two-thirds, 68.5%, were at or above 30%. Another 41.3% were at or above 35%.
Not a few bad districts, a systemic condition
The median district chronic absenteeism rate was 33.4%. That puts the midpoint of the reported district distribution above one in three students. The median is 33.4% again when every district is measured only on the schools whose attendance the state publishes.
What a district row counts
Oregon's district-level chronic absenteeism row counts every student the state measured in the district, including students in district-sponsored online programs and other schools whose own attendance rows the state suppresses. Subtract the published school rows from the district row and what remains is a residual: students the district row counts that no school row accounts for. Online programs record very low chronic-absence rates, so a district carrying a large residual can post a district rate that describes who is counted rather than who is attending.
Across most of the state this changes nothing. In 2024-25, 9 of the 184 reporting districts carried a residual above 10% of their measured students, and 4 carried one above 25%. All 184 publish at least one school row, so both bases can be computed for every one of them. The gap concentrates at the bottom of the distribution. Marcola's district row reads 8.4%, but 71.3% of the students behind it fall outside any published school row; the 2 schools Marcola does report stand at 21.2%. Nyssa reads 10.6% against 18.3% in the schools it reports, with a residual of 50.1%.
Thirty districts reported district-row rates below 25%. On the school-reported basis the count is 28. Port Orford-Langlois SD 2CJ↗ET moves from 21.0% to 29.0%, and Yamhill Carlton SD 1↗ET from 22.2% to 25.8%. Lake Oswego SD 7J↗ET, at 18.1% on its district row, is below the threshold on either basis.
The chart shows the 10 lowest rates on the school-reported basis, not all 28 below the threshold. These are small districts: the largest of the ten counts 803 students in the schools it reports.
The historical shift
In 2014-15, 14.8% of reporting Oregon districts had rates at or above 25%. The share was 20.4% in 2018-19, rose to 87.0% in 2021-22, and peaked at 91.3% in 2022-23.
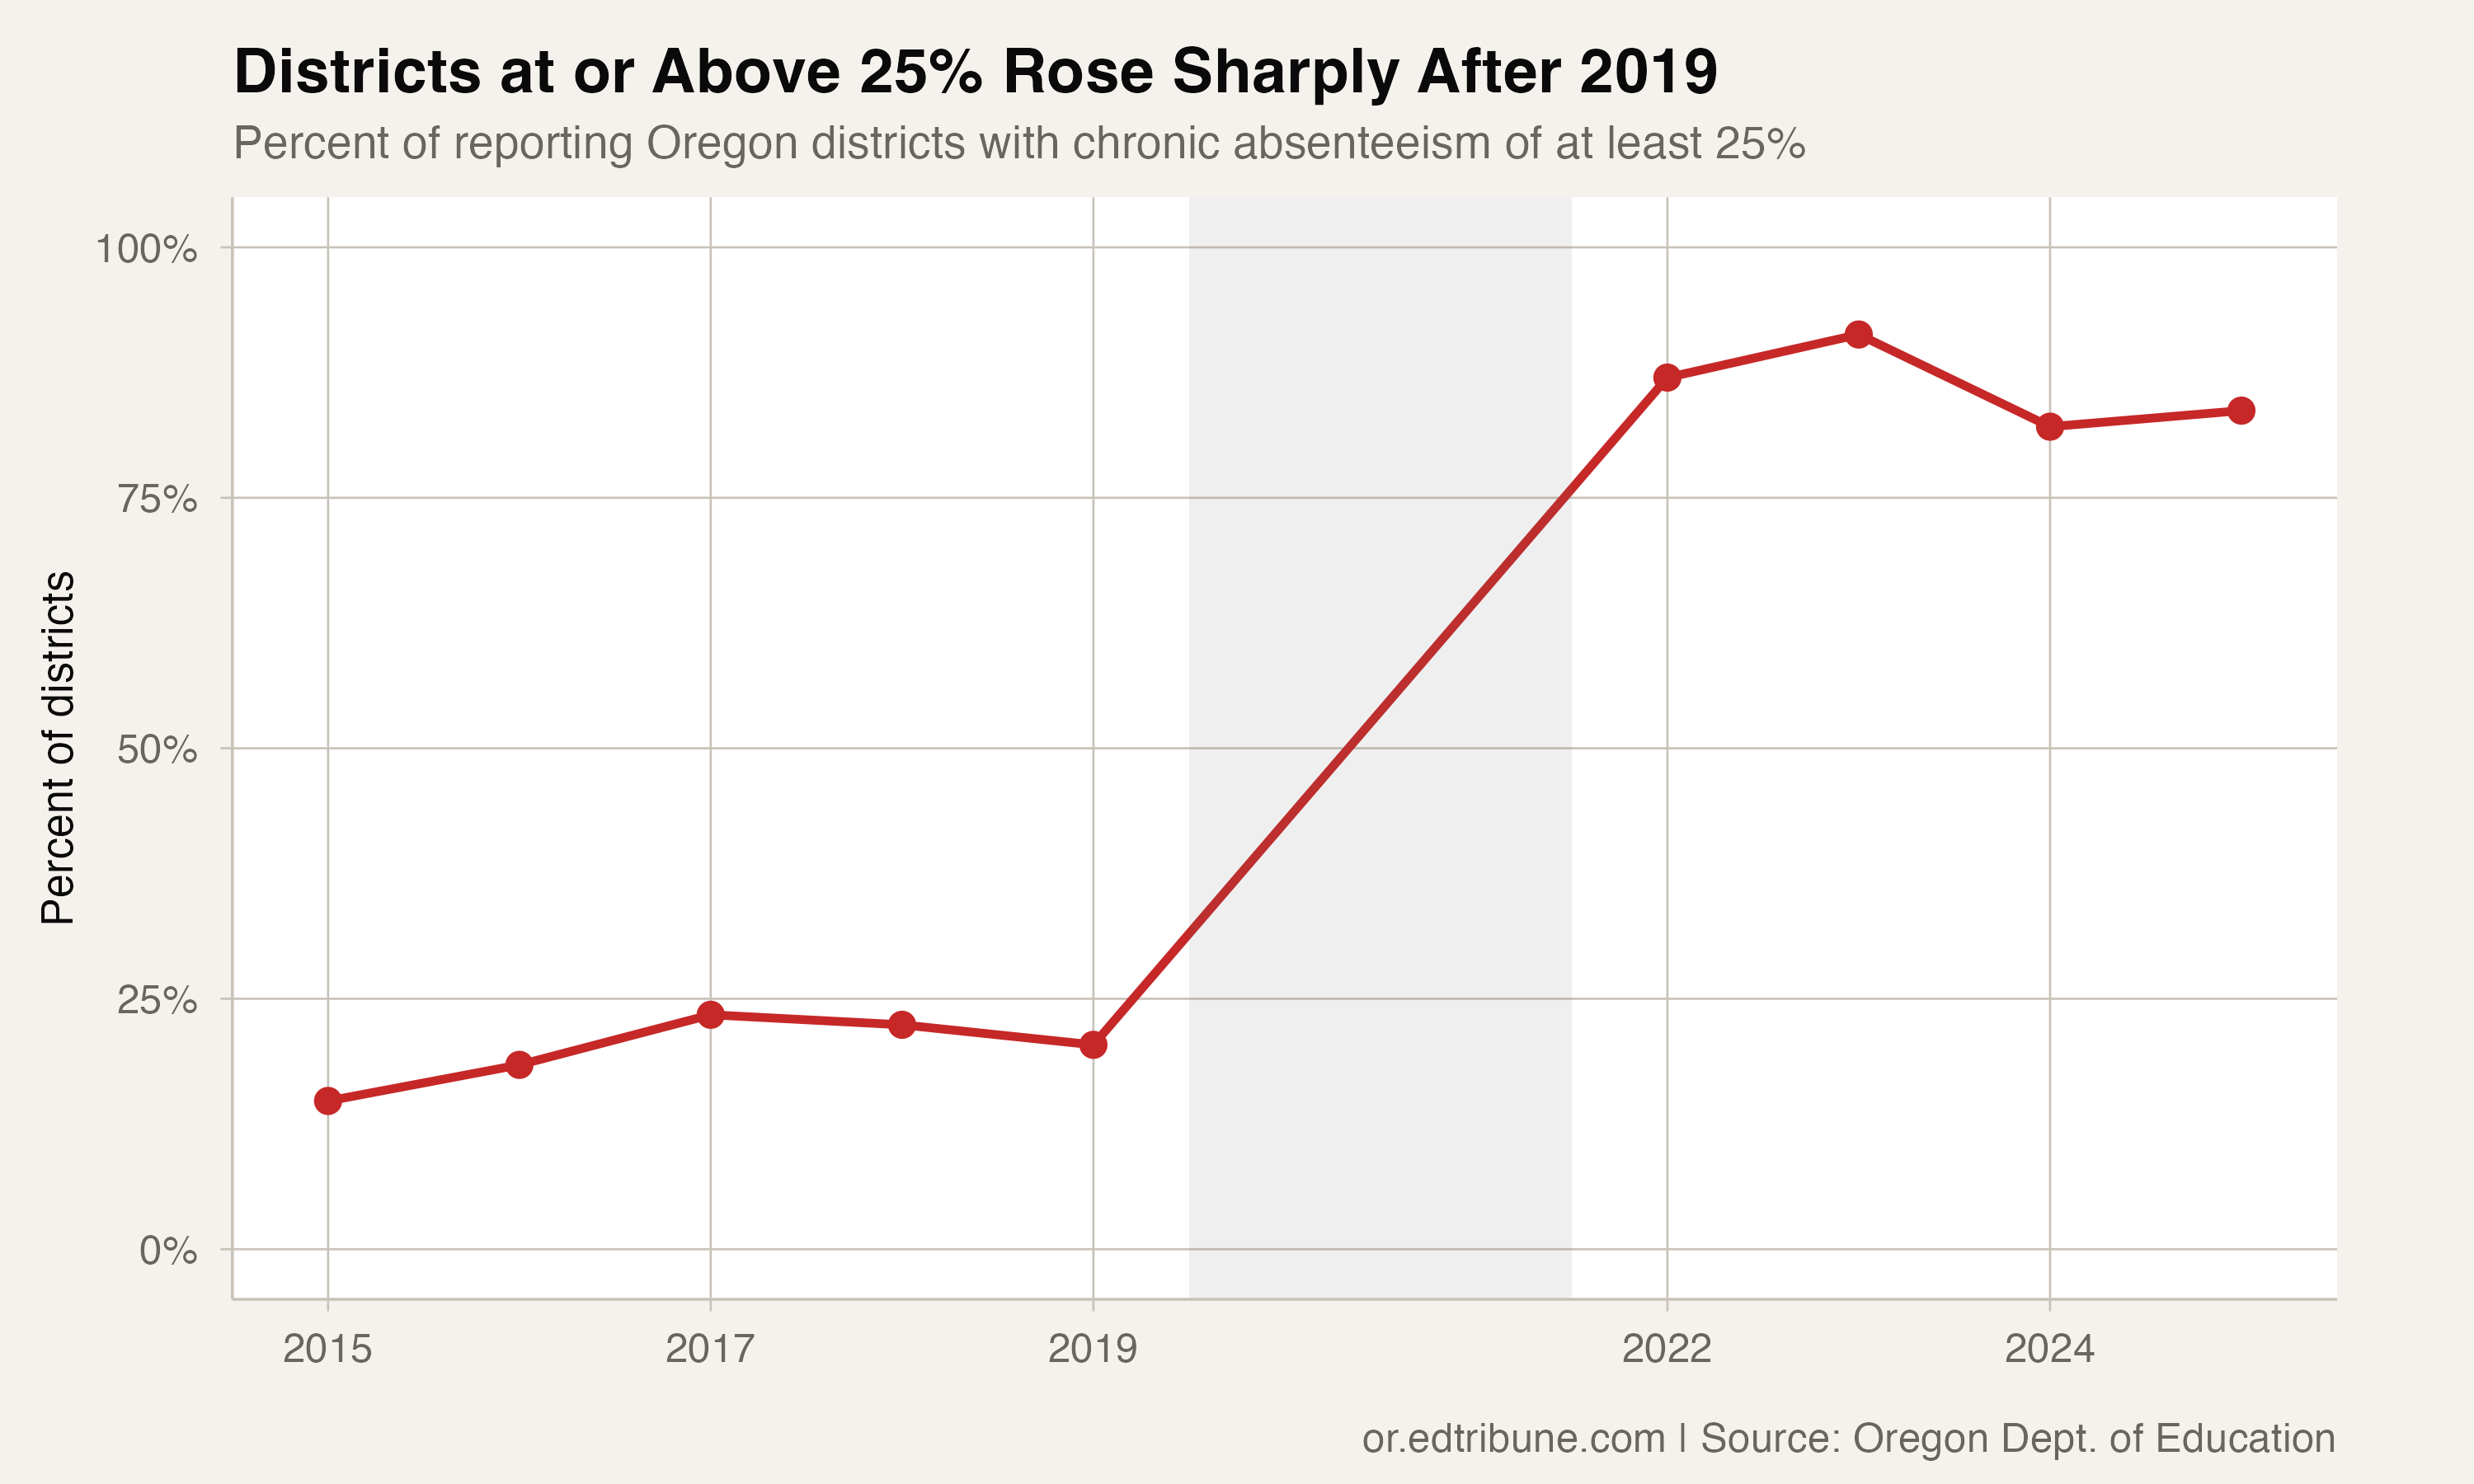
The share fell to 82.1% in 2023-24 before rising to 83.7% in 2024-25. That leaves it 7.6 percentage points below the 2022-23 peak and 63.3 points above 2018-19. Computed on the school-reported basis instead, the same series never differs from these figures by more than 3.3 percentage points in any of the 9 reported years. The series establishes the change; it does not isolate what caused it.
The higher thresholds
Above 25% is just the entry point. Among Oregon's 184 districts:
- 126 (68.5%) have rates at or above 30%
- 76 (41.3%) are at or above 35%
- 34 (18.5%) are at or above 40%
- 5 (2.7%) are at or above 50%, a majority of their students chronically absent
On the school-reported basis those four counts differ by no more than three districts.
What the distribution establishes
The 2024-25 distribution shows that high chronic absenteeism rates were widespread across reporting districts, not confined to a small tail, and that finding holds on both bases. It does not determine which interventions Oregon should use or why individual district rates changed.
Analysis uses district and school chronic absenteeism data published by the Oregon Department of Education.
Detailed code that reproduces the analysis and figures in this article is available exclusively to EdTribune subscribers.
Discussion
Sign in to join the discussion.
Loading comments...