Correction: An earlier version included unsupported claims about community income, poverty, school spending, student services and the causes of the attendance gap. It also converted district rates into hypothetical days missed by a typical student. The attendance data do not establish those claims, so they have been removed. Previously corrected 2014-15 rates remain unchanged, and every number and chart has been rechecked against the complete current state series.
In this series: Oregon Chronic Absenteeism.
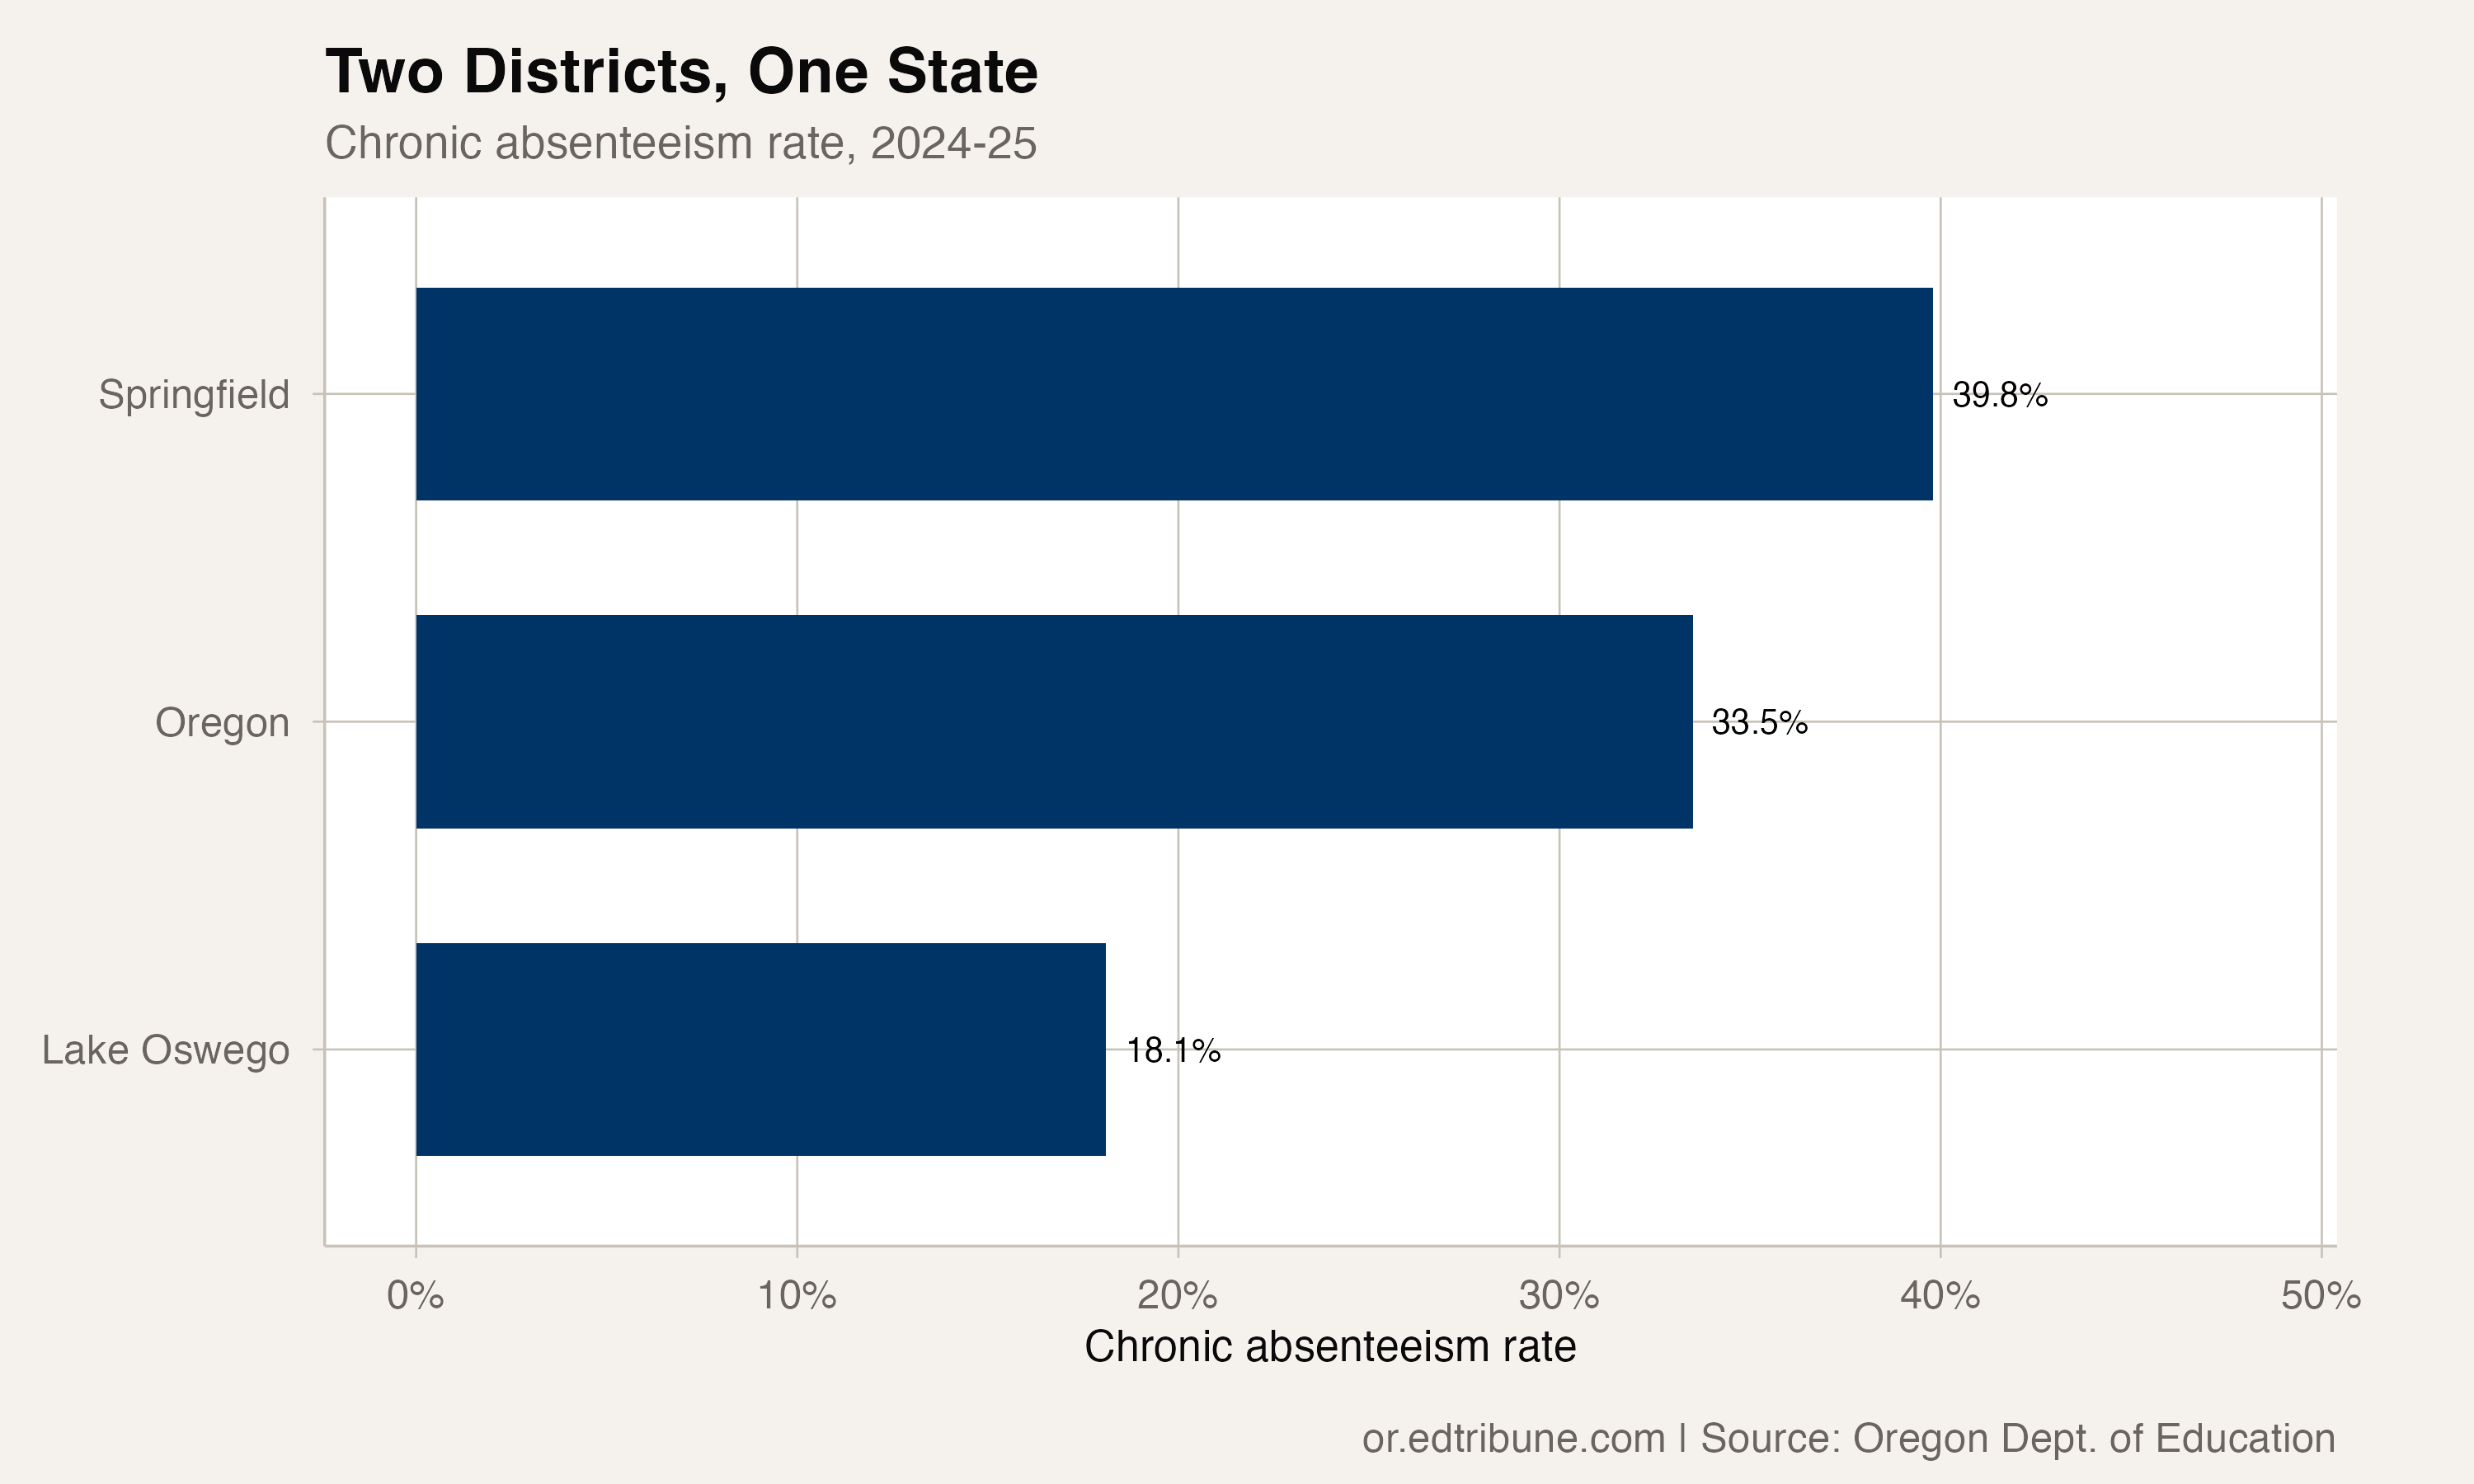
Lake Oswego↗ET and Springfield↗ET reported sharply different chronic absenteeism rates in 2024-25. Lake Oswego's rate was 18.1%. Springfield's was 39.8%. The difference was 21.7 percentage points.
The rate represents the share classified as chronically absent under Oregon's regular-attendance measure. It does not say how many days the average student missed, and it cannot identify why the districts differ.
A gap in every available year
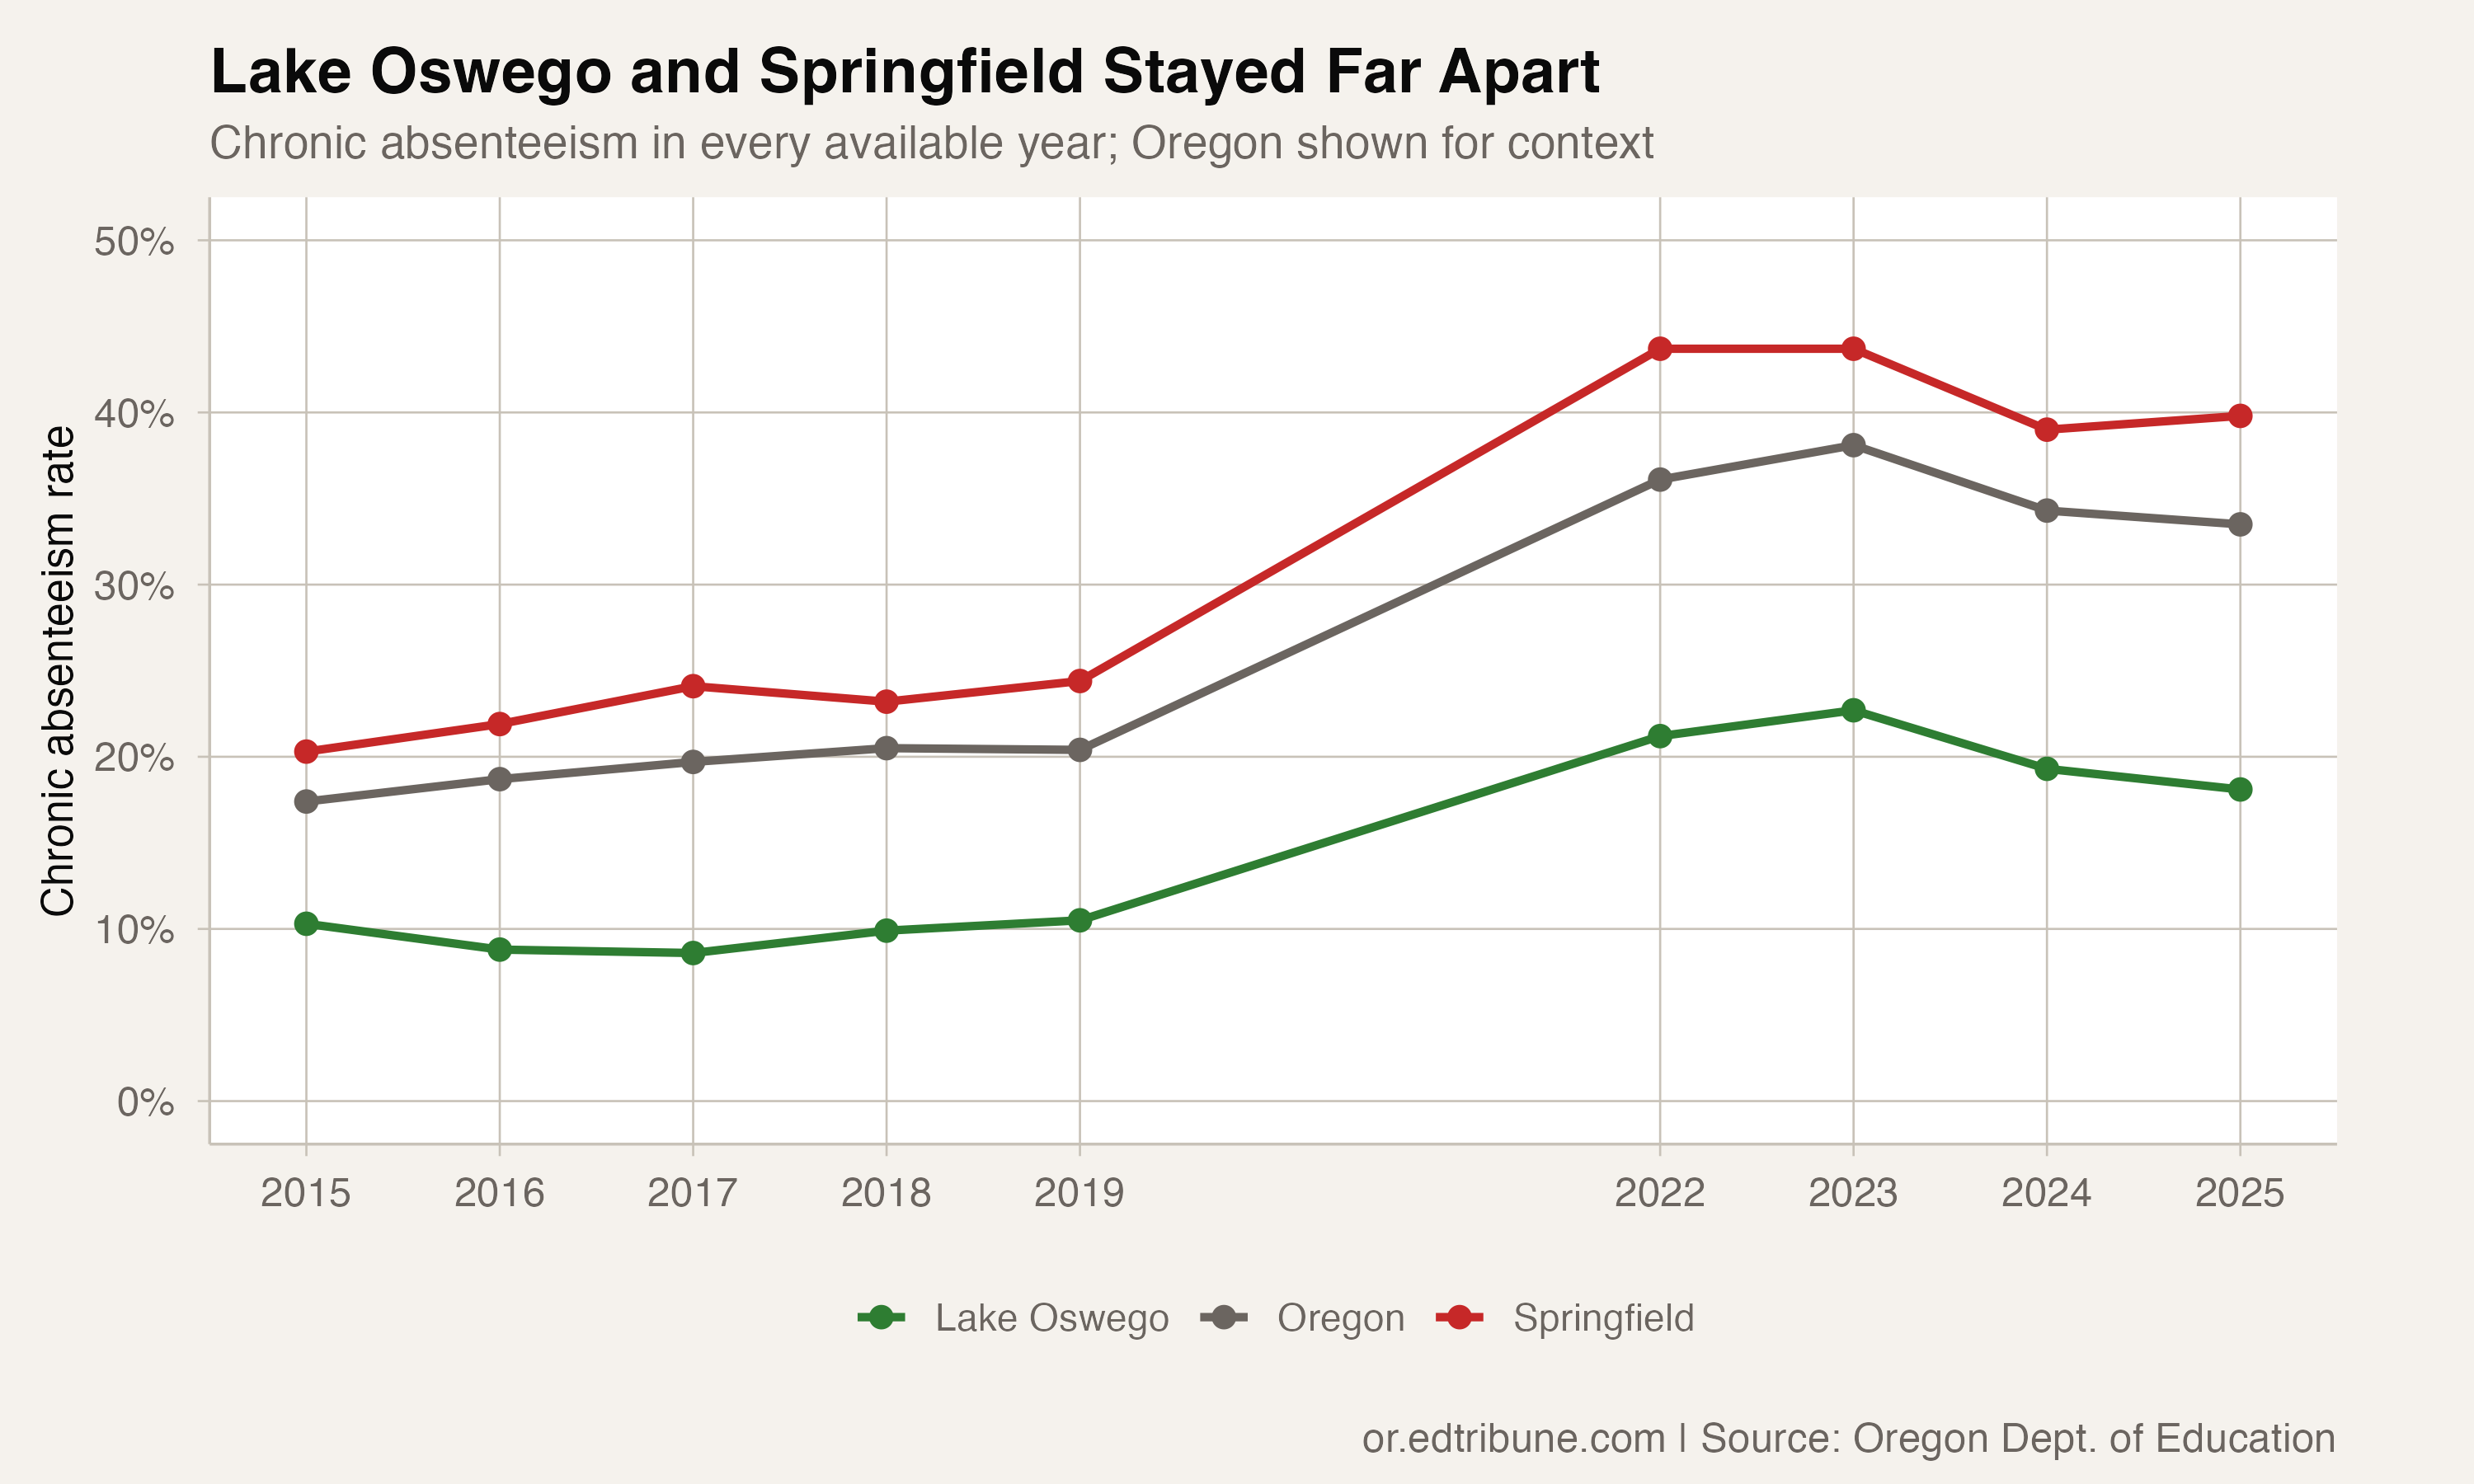
Oregon reports nine years in the available district series, with a two-year pandemic-era break. Lake Oswego had the lower chronic absenteeism rate in every one of those years.
In 2014-15, Lake Oswego reported 10.3% and Springfield reported 20.3%, a 10-point gap. By 2018-19, the rates were 10.5% and 24.4%, widening the gap to 13.9 points.
The gap reached 22.5 points in 2021-22, the largest difference in the available series. It narrowed to 21 points the following year and 19.7 points in 2023-24 before widening to 21.7 points in 2024-25.
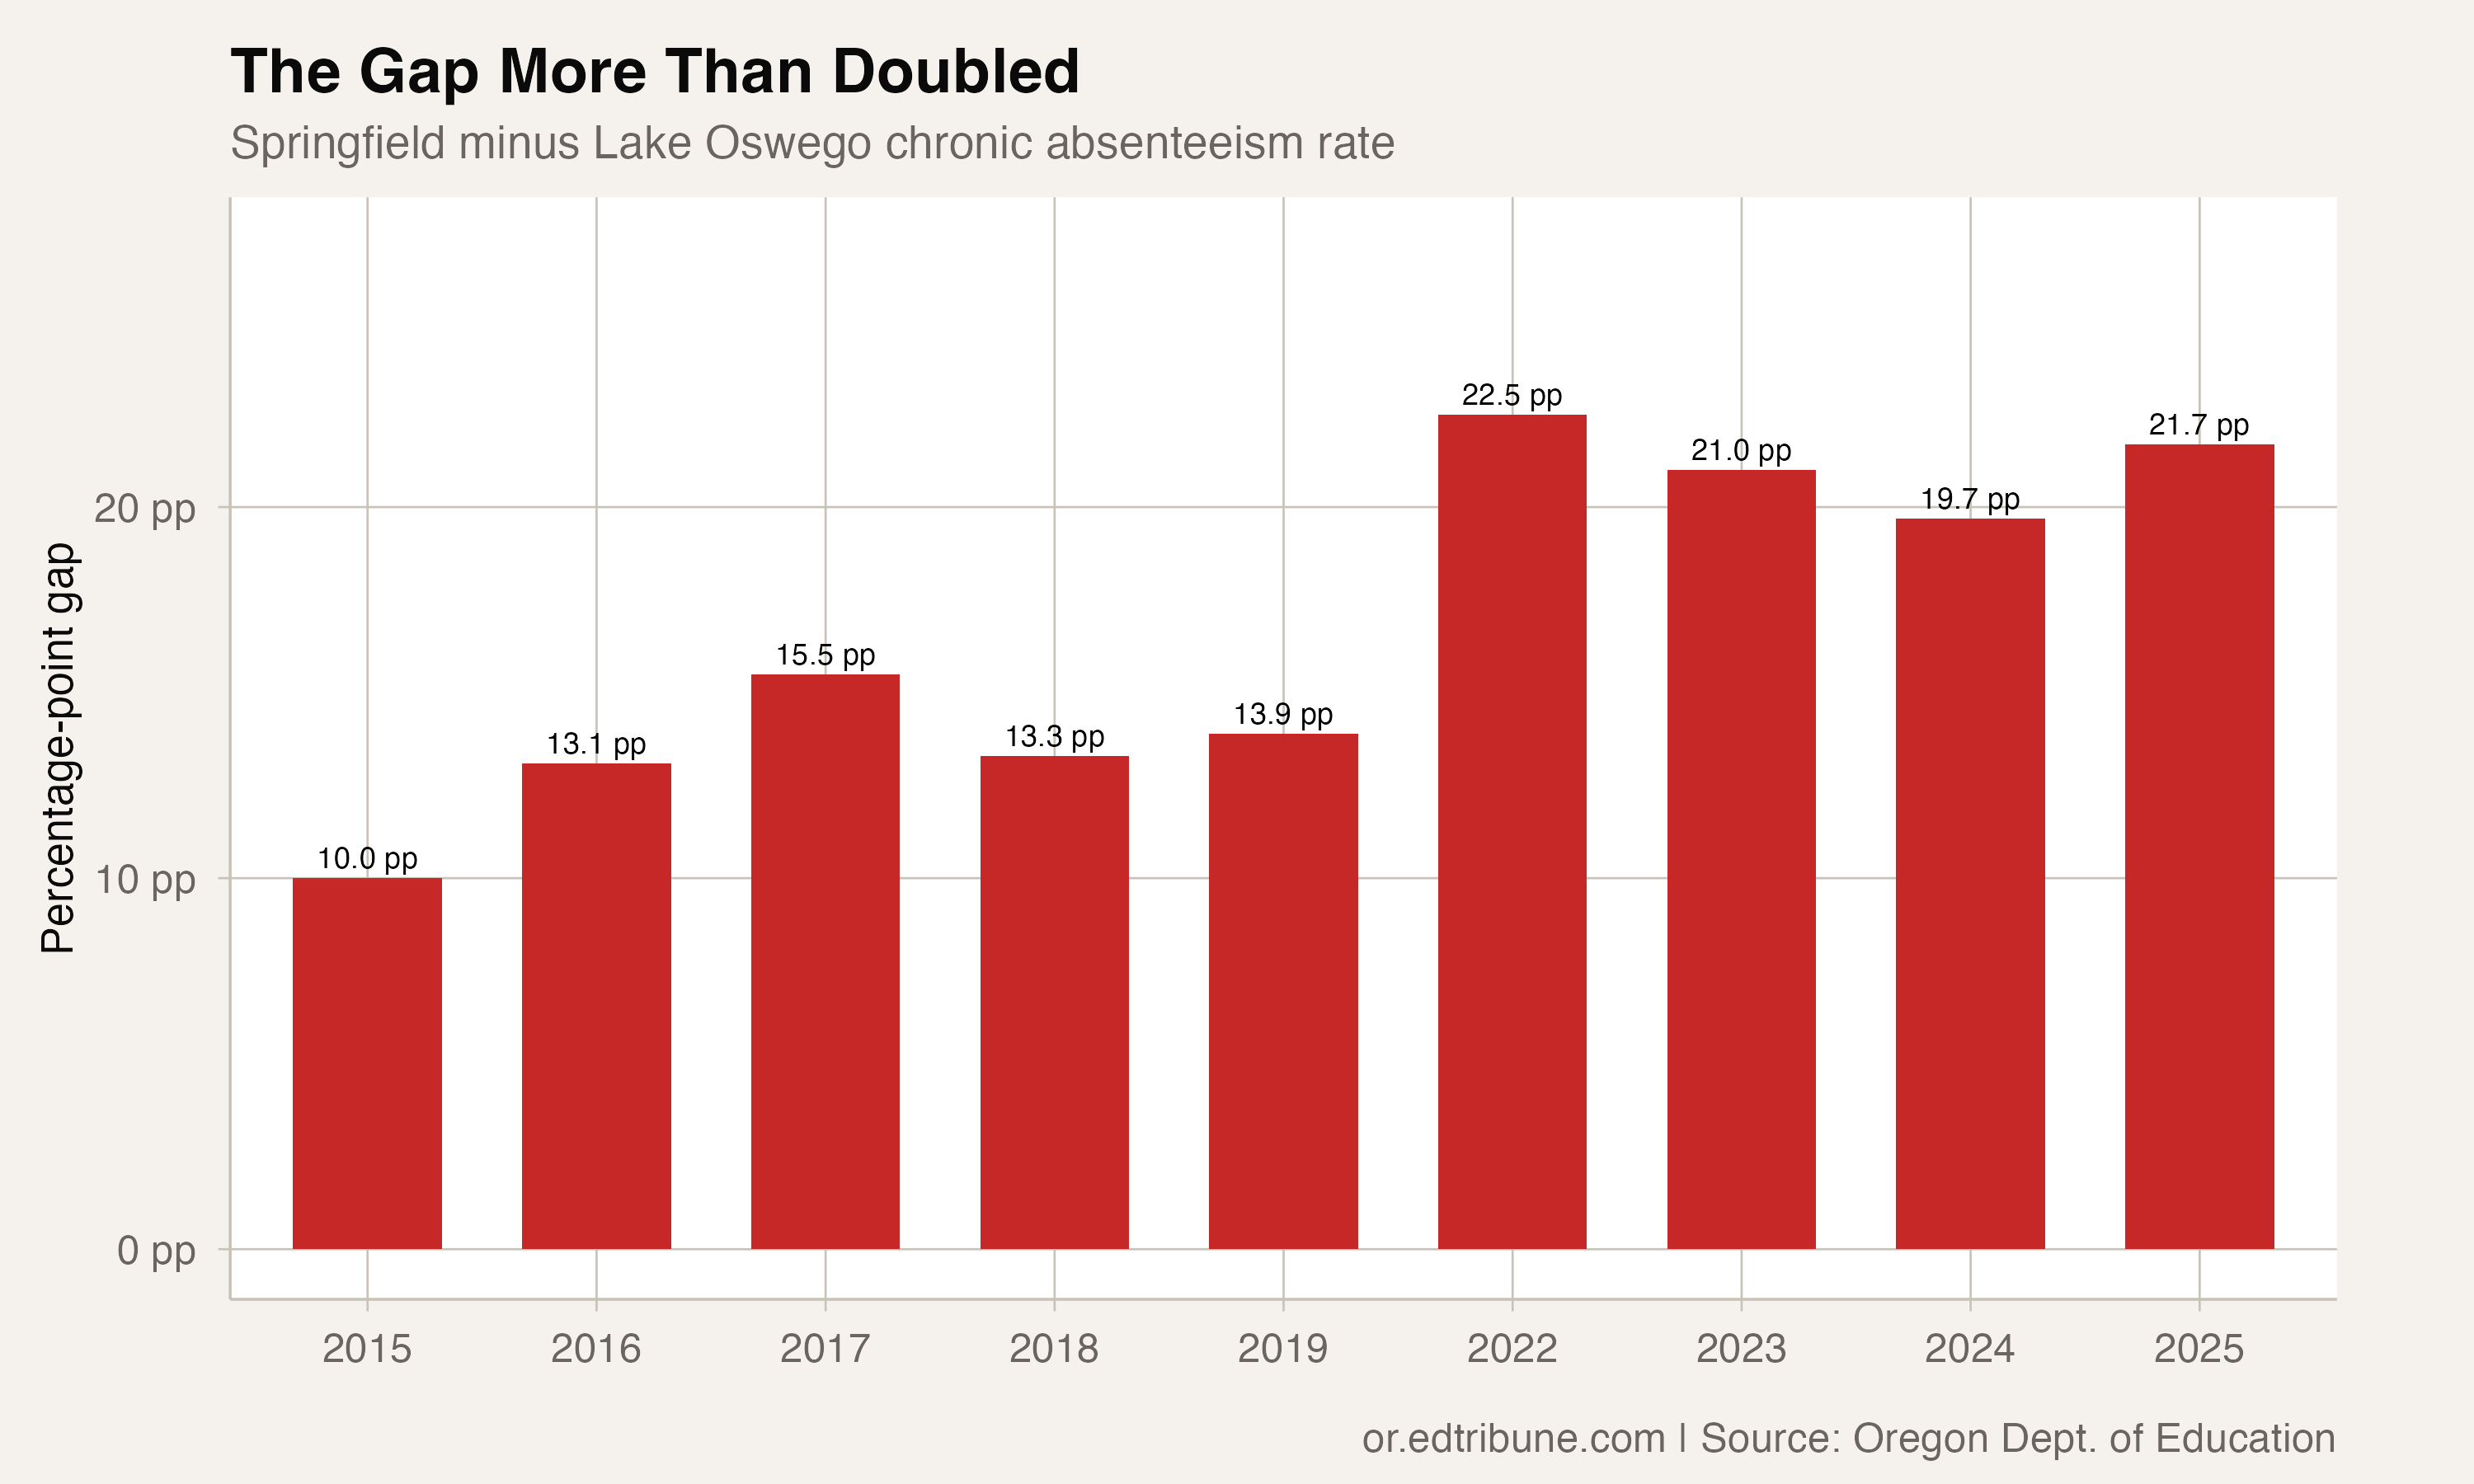
Across the full comparison, Lake Oswego's rate rose by 7.8 points, from 10.3% to 18.1%. Springfield's rose by 19.5 points, from 20.3% to 39.8%. The gap between them grew by 11.7 points.
That pattern is stronger than a comparison based on one unusual year. The difference was smallest at 10 points in the first year and remained at least 13.1 points in every later observation.
On opposite sides of the state rate
Lake Oswego was below Oregon's statewide chronic absenteeism rate in all nine available years. Springfield was above the statewide rate in all nine.
In 2024-25, Oregon's rate was 33.5%, between Lake Oswego's 18.1% and Springfield's 39.8%.
The ranges did not completely overlap. Lake Oswego's highest rate was 22.7% in 2022-23. Springfield's lowest was 20.3% in 2014-15. In each same-year comparison, however, Springfield's rate was higher.
Rates and student counts
The 2024-25 attendance records cover 6,747 students in Lake Oswego and 8,659 in Springfield. They identify 1,218 chronically absent students in Lake Oswego and 3,449 in Springfield.
Those counts explain the reported rates, but they do not make the two districts interchangeable. Enrollment size, student composition and local circumstances can all differ. This dataset describes the attendance outcomes; it does not contain evidence that isolates a mechanism behind the gap.
The durable conclusion is narrower and well supported: Lake Oswego and Springfield have remained far apart throughout Oregon's available chronic absenteeism history, and their 2024-25 difference is more than twice the size of their 2014-15 gap.
Detailed code that reproduces the analysis and figures in this article is available exclusively to EdTribune subscribers.
Discussion
Sign in to join the discussion.
Loading comments...