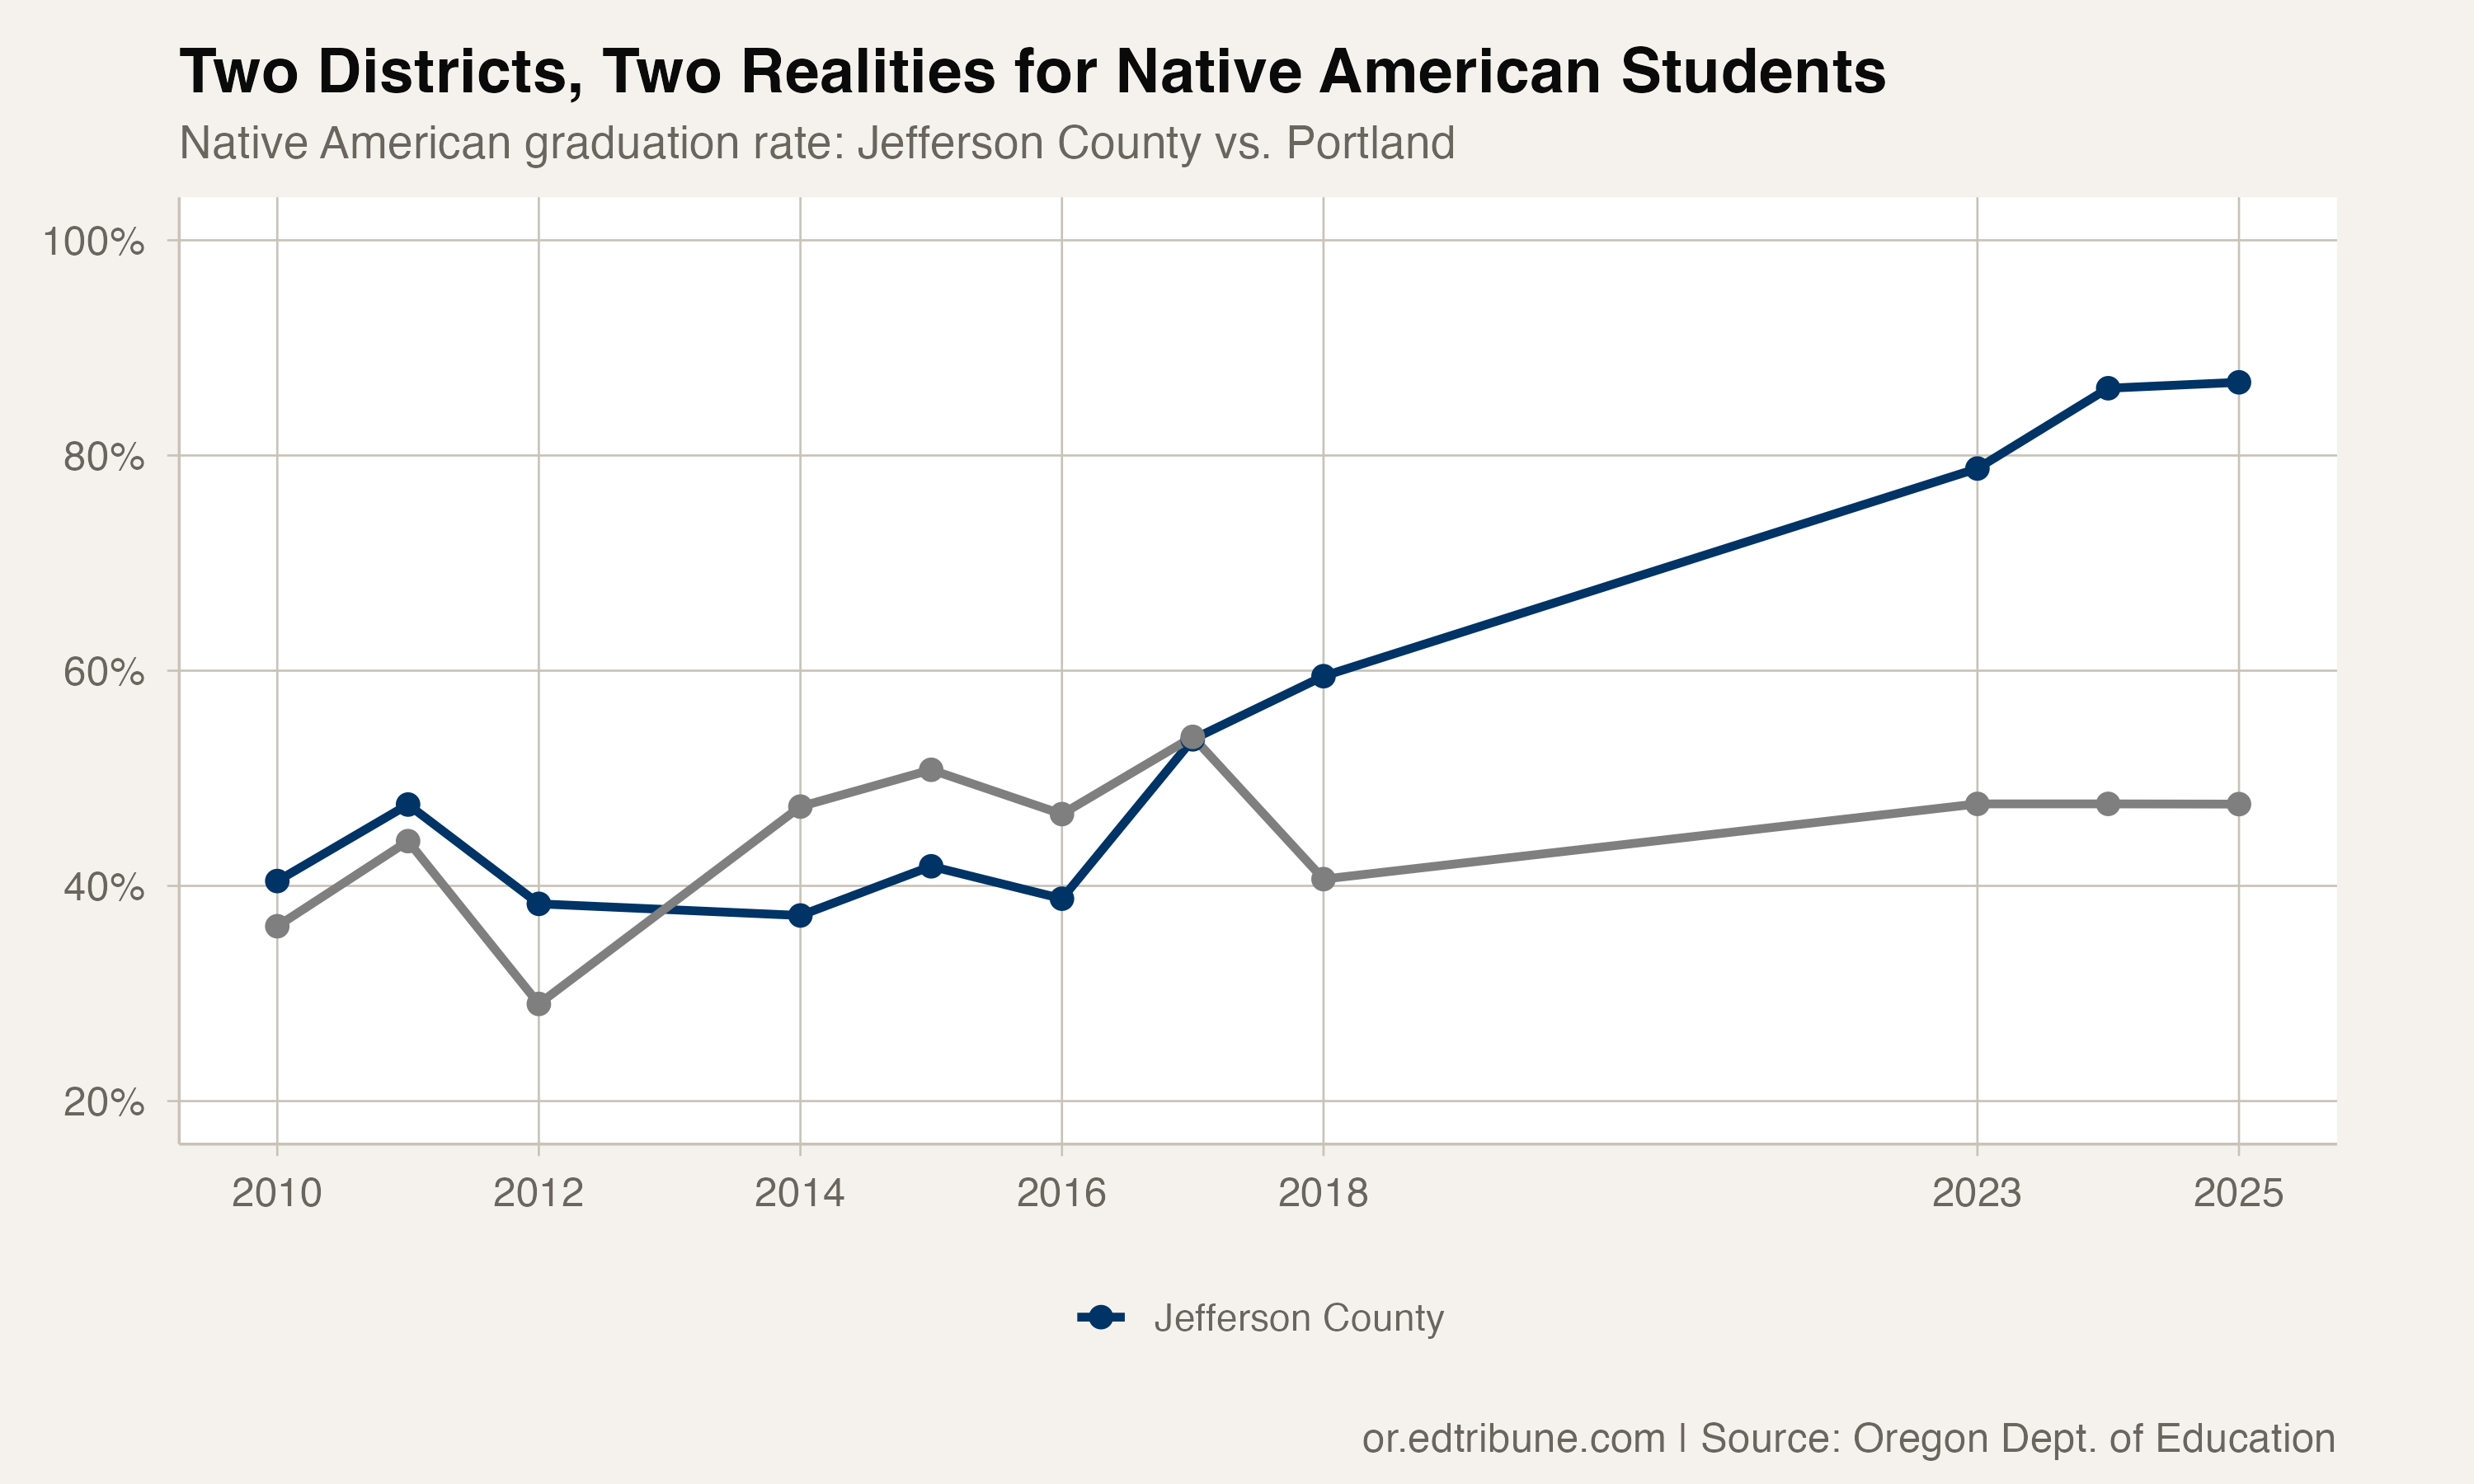
Jefferson County SD 509J graduates Native American students at 86.8%. Portland SD 1J graduates them at 47.6%. Same state, same year, same population -- a 39-point gap between two districts 120 miles apart.
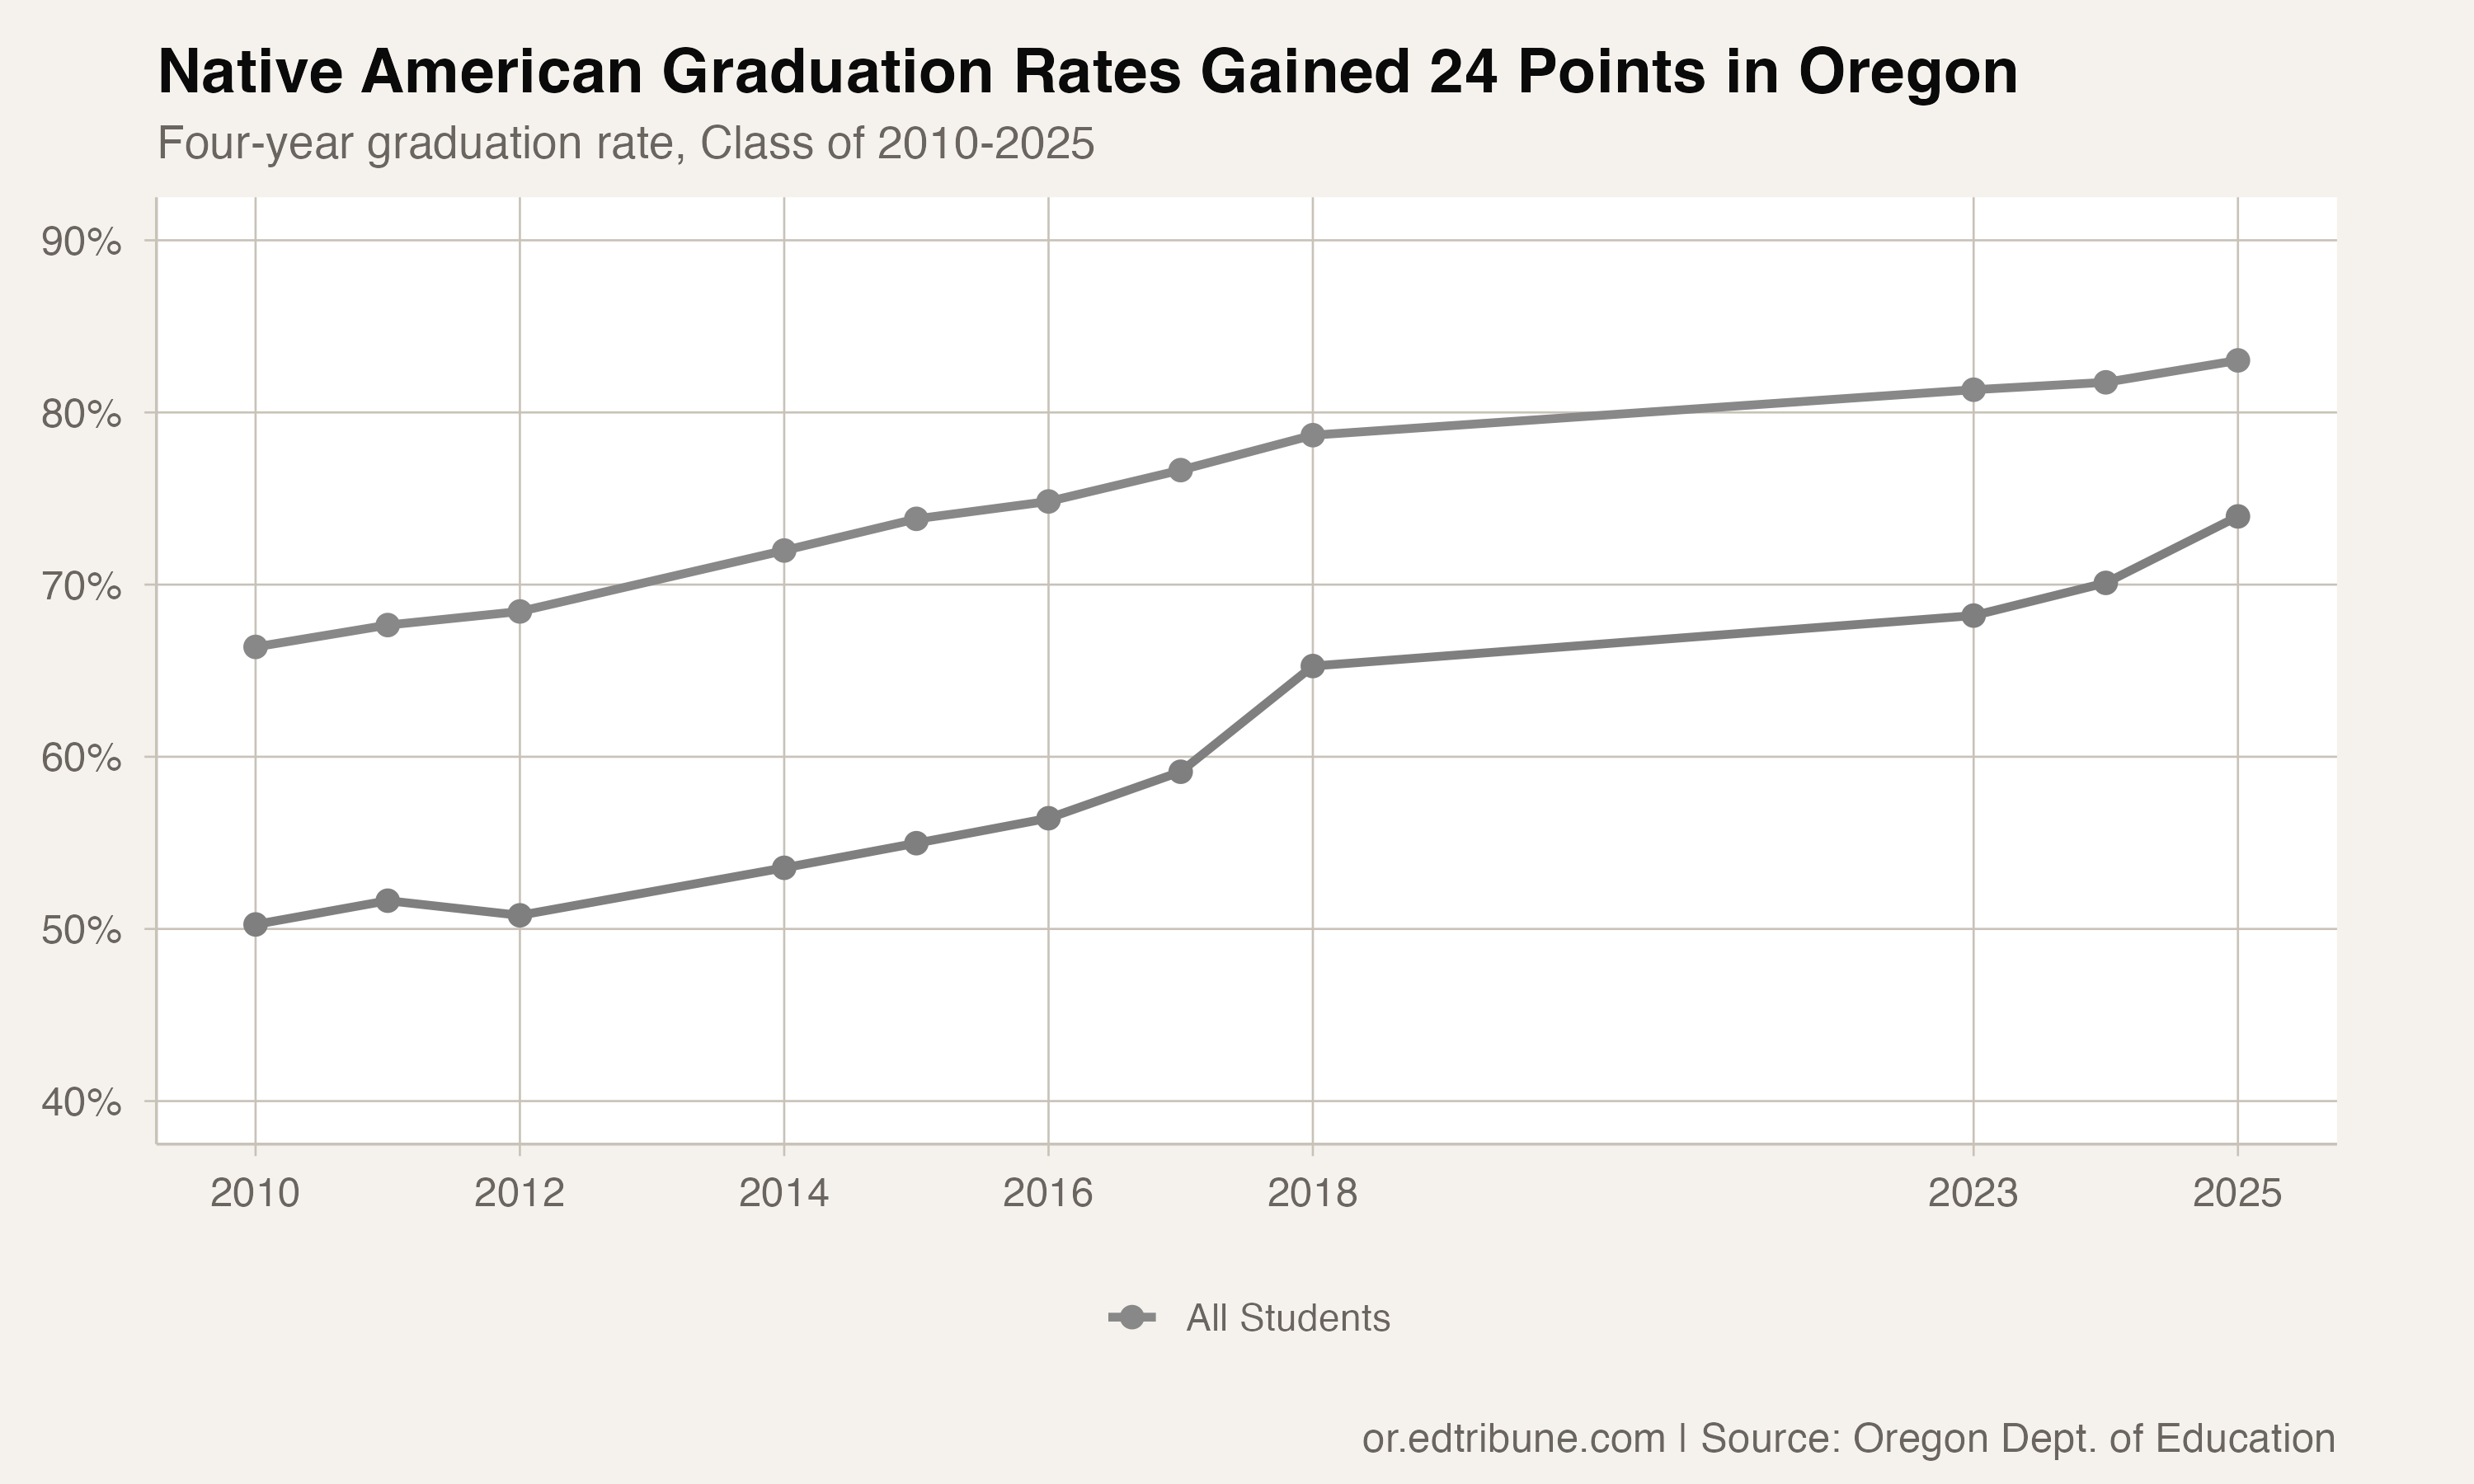
Oregon's statewide Native American graduation rate has climbed from 50.3% to 74.0% since 2010, a 23.7-point gain that narrowed the gap to the state average from 16.1 points to 9.0. But the statewide number papers over district-level realities that look nothing alike.
Two districts, two realities
Jefferson County SD 509J↗ET, home to the Warm Springs Reservation, graduated Native American students at 86.8% in 2025. The district's overall rate reached 91.7%, and its trajectory has been steadily upward for a decade.
In Portland SD 1J↗ET, the state's largest district, Native American students graduated at 47.6% for the third consecutive year. The rate has barely moved since the mid-2010s. The gap between Native American students and the Portland district average is 34.9 percentage points.
The contrast is hard to overstate. In Jefferson County, a district that serves a tribal community in rural Central Oregon, nearly nine in ten Native American students graduate on time. In Portland, fewer than half do.
Where the data reaches
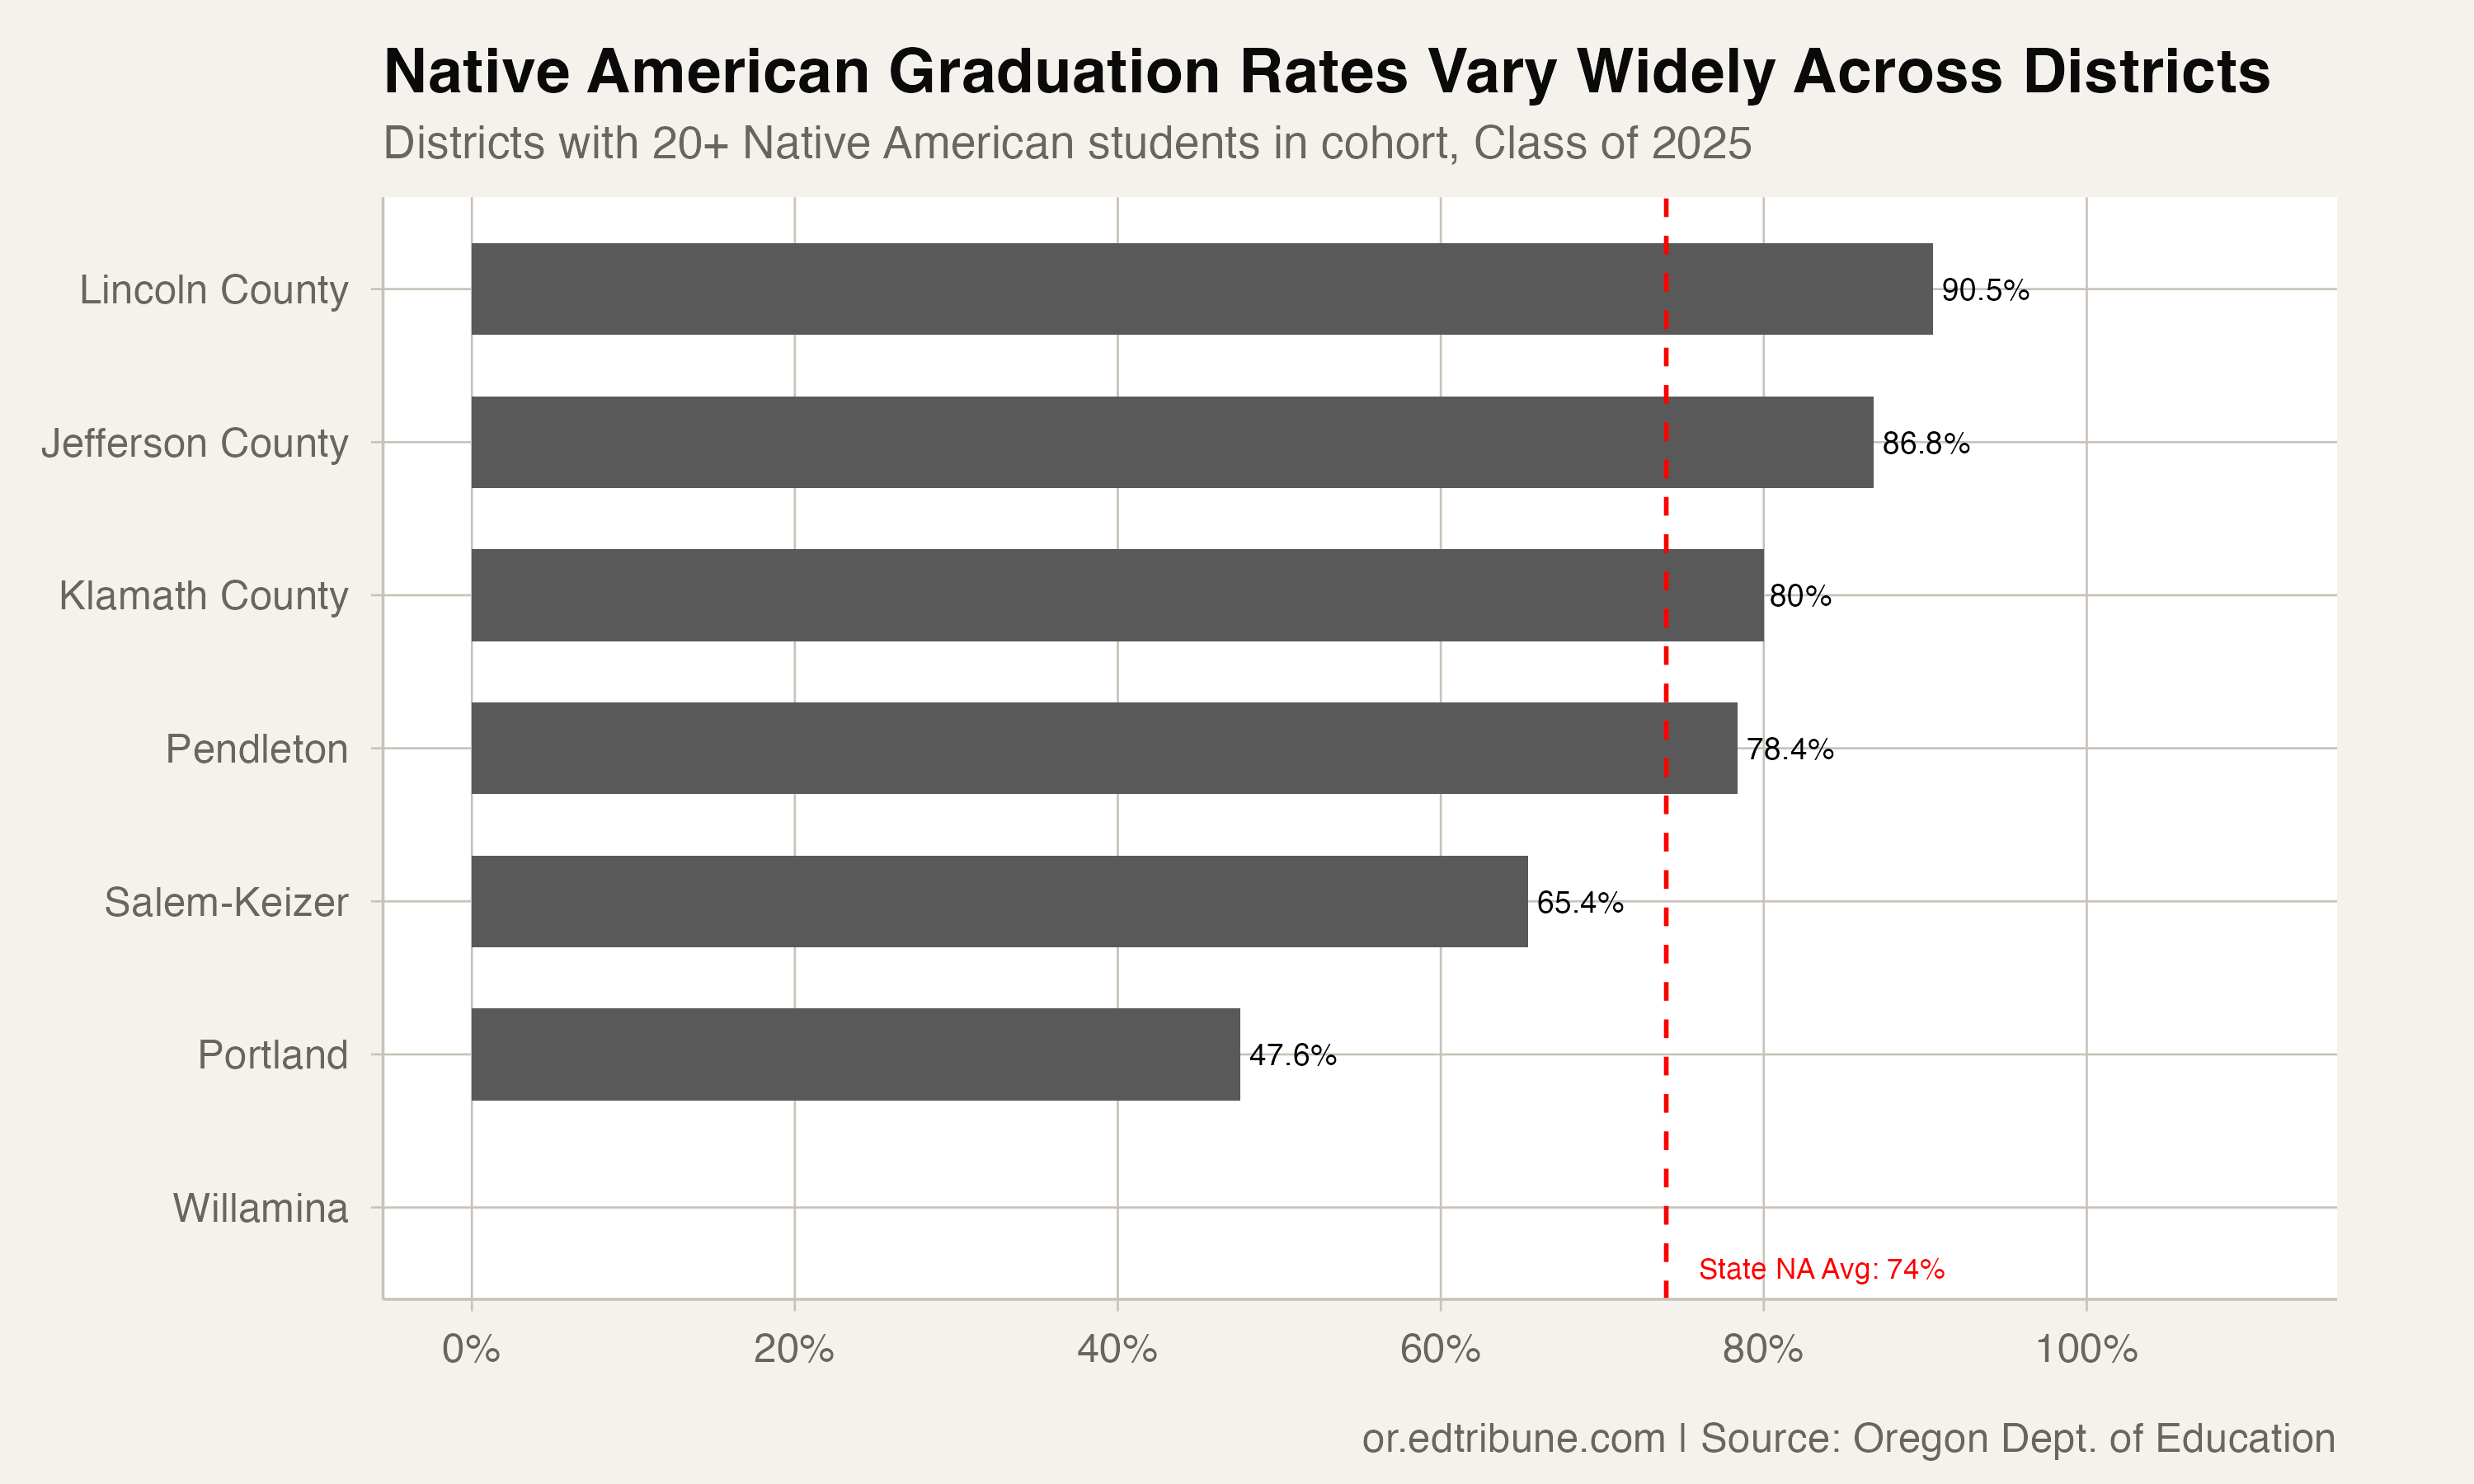
Only seven districts had large enough Native American graduating cohorts (20 or more students) to report reliable rates in 2025. Among them, graduation rates ranged from 47.6% in Portland to 90.5% in Lincoln County:
| District | Graduation Rate | Cohort |
|---|---|---|
| Lincoln County SD | 90.5% | 21 |
| Jefferson County SD 509J | 86.8% | 68 |
| Klamath County SD | 80.0% | 35 |
| Pendleton SD 16 | 78.4% | 37 |
| Salem-Keizer SD 24J | 65.4% | 26 |
| Portland SD 1J | 47.6% | --- |
The small cohort sizes in most districts mean that year-to-year rates can swing dramatically. But Portland's three years of near-identical rates at 47.6% reflects something more persistent than statistical noise.
The statewide arc
The improvement from 50.3% to 74.0% at the state level did not follow a straight line. The rate climbed from 50.3% in 2010 to 65.3% by 2018. After the COVID-era data gap (Oregon did not publish comparable graduation data from 2019 through 2022), the rate resumed at 68.2% for the Class of 2023 and has continued upward to 74.0%.
The gap to the state average tells a more nuanced story. It narrowed from 16.1 points in 2010 to 9.0 points in 2025, reaching its narrowest point this year. The 2024 gap was 11.7 points, so the most recent year represents meaningful progress.
Oregon is home to nine federally recognized tribes, and the state has expanded tribal higher education grants in recent years. In 2025, 616 tribal education grants were awarded, up from 412 in prior years. These supports may be contributing to the upstream improvements that feed into graduation rates, but the connection is indirect.
Why Portland's number matters most
Portland's 47.6% rate is not the lowest Native American graduation rate in the state -- the statewide rate includes districts too small to report separately. But Portland is the largest district in Oregon, and its Native American students represent a significant share of the statewide cohort.
When a district of Portland's size and resources cannot move the needle for Native American students over three consecutive years, it raises questions about whether the supports in place are reaching the students who need them. The district has Native American community liaisons and partners with organizations like the Native American Youth and Family Center, but the rate has not responded.
The statewide improvement to 74.0% is real progress. But as long as Portland's Native American graduation rate remains stuck below 50%, the statewide number overstates how much has changed for the students who are most at risk.
Four-year adjusted cohort graduation rate data from the Oregon Department of Education. Data covers the Class of 2010 through the Class of 2025, excluding 2013 and 2019-2022. Duplicate rows averaged. District-level Native American rates reported only where the cohort includes 20 or more students. Oregon's essential skills testing requirement has been suspended through 2027-28.
Detailed code that reproduces the analysis and figures in this article is available exclusively to EdTribune subscribers.
Discussion
Sign in to join the discussion.
Loading comments...