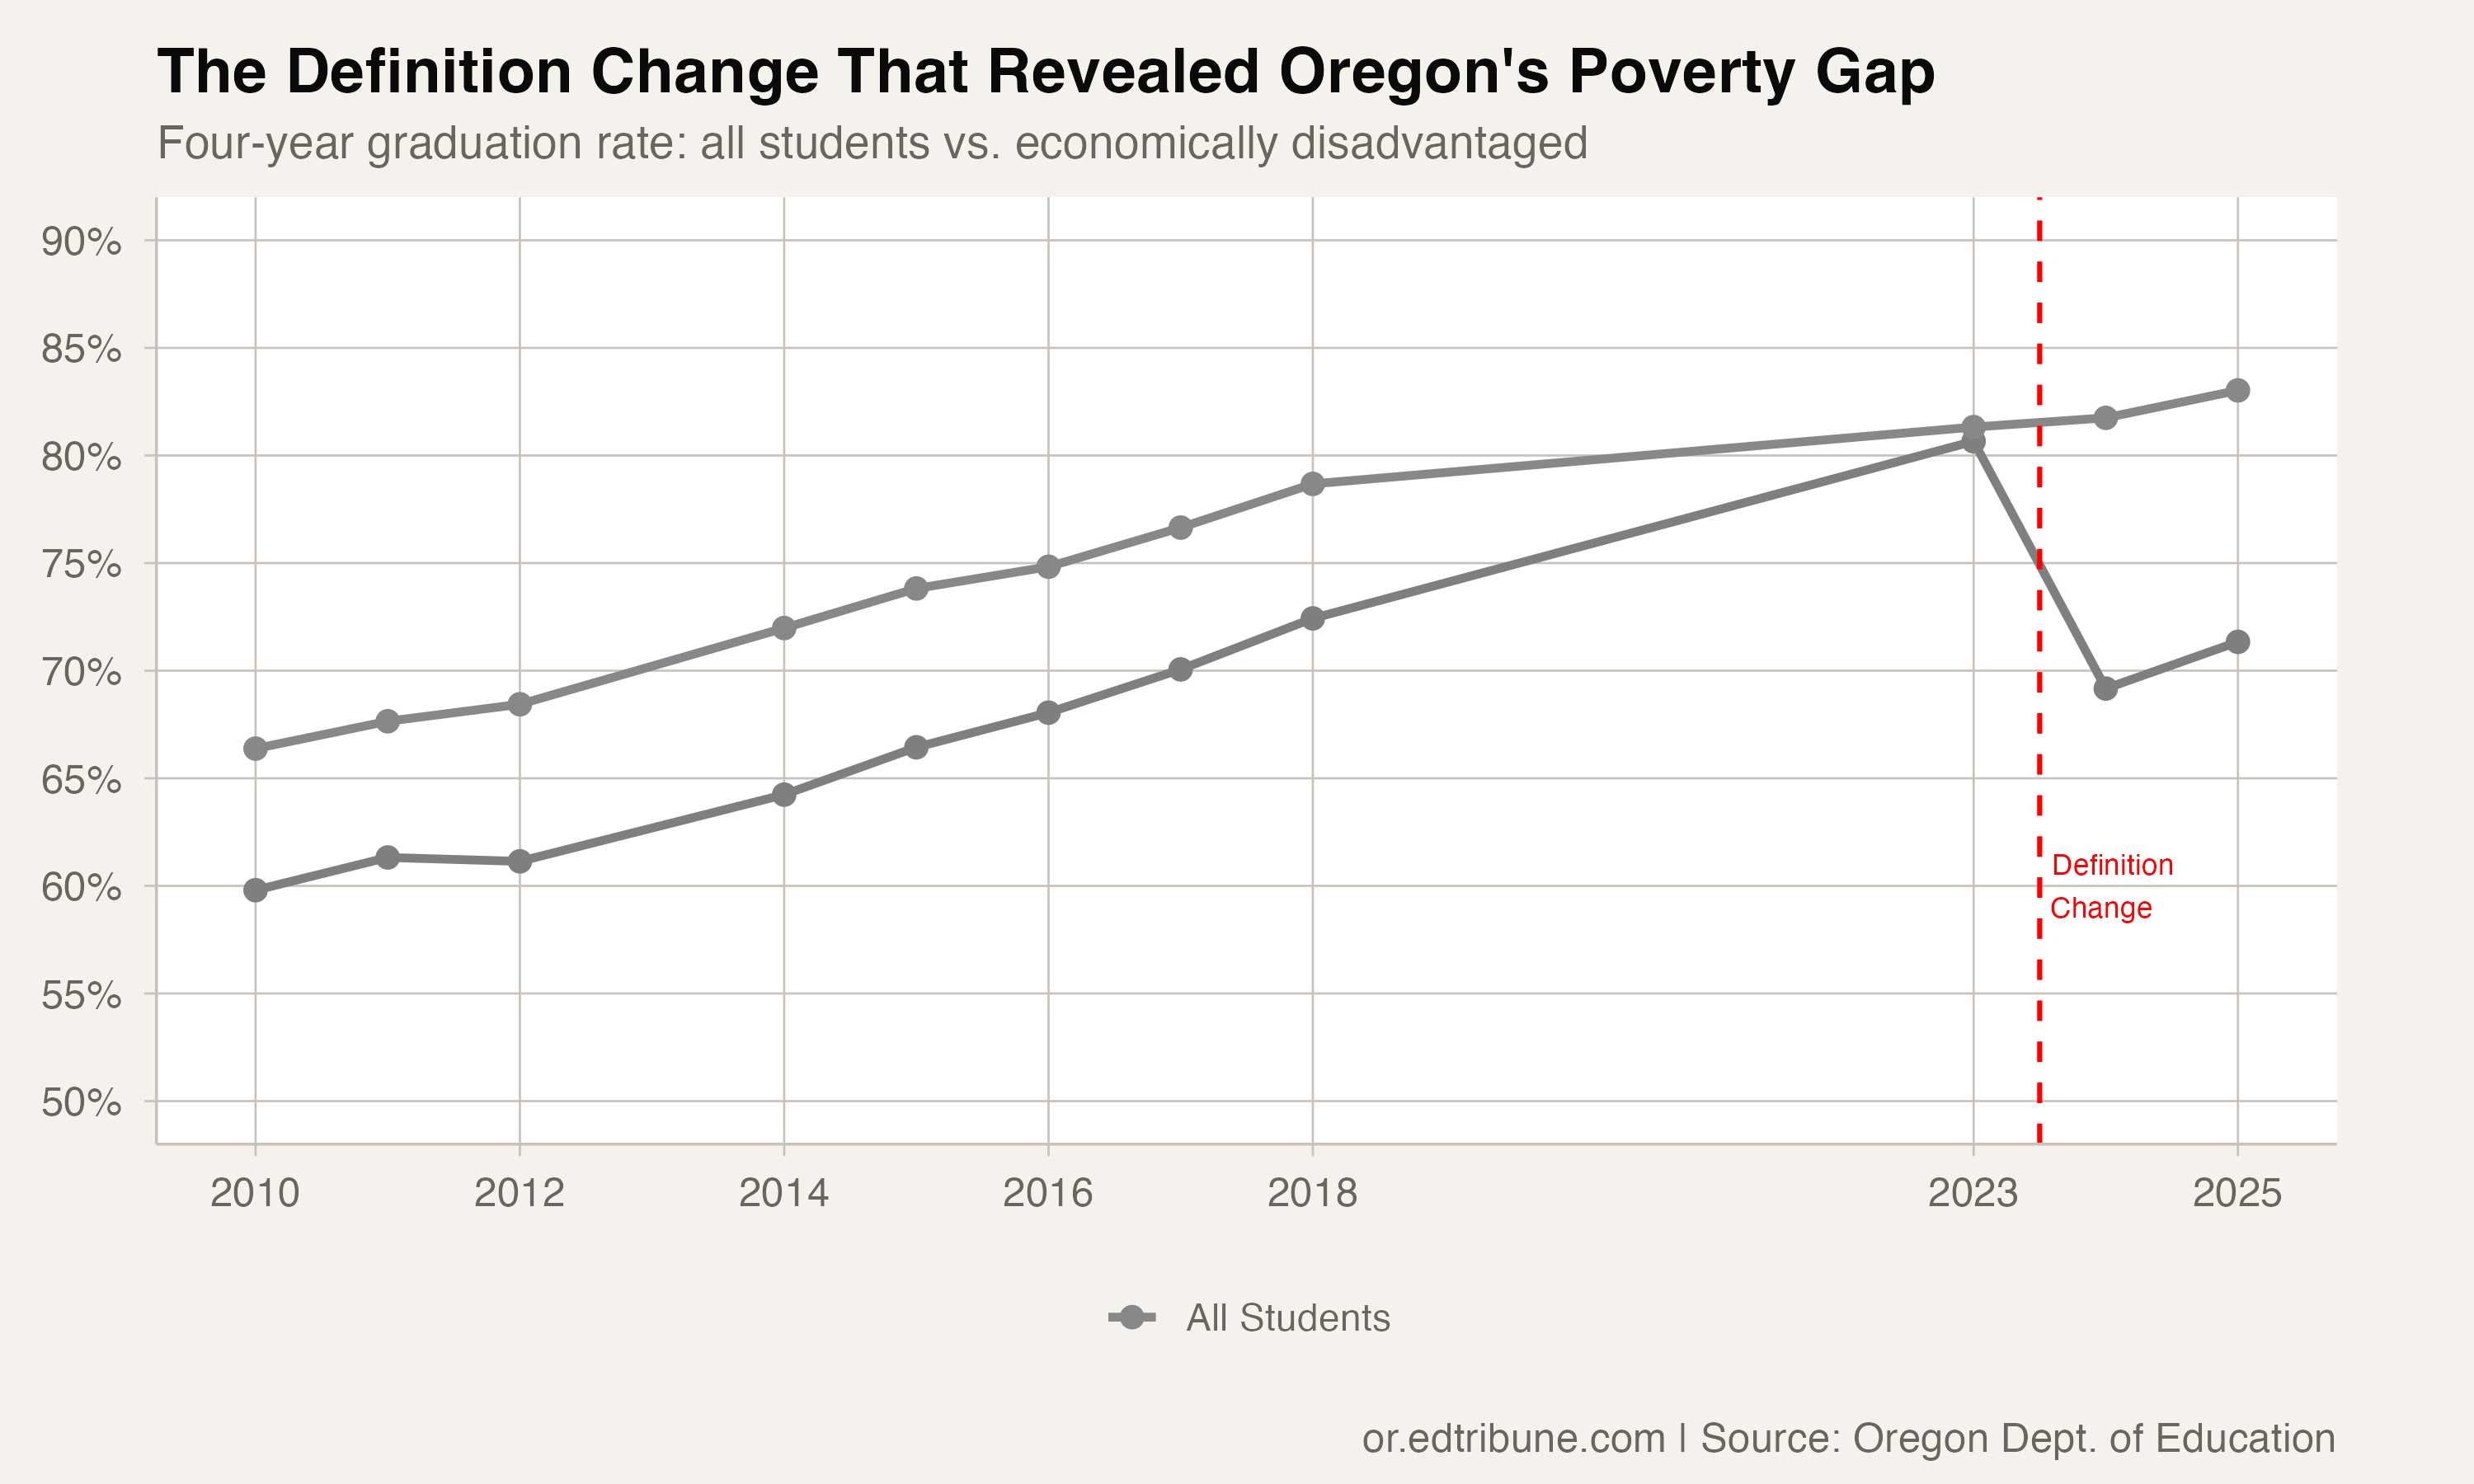
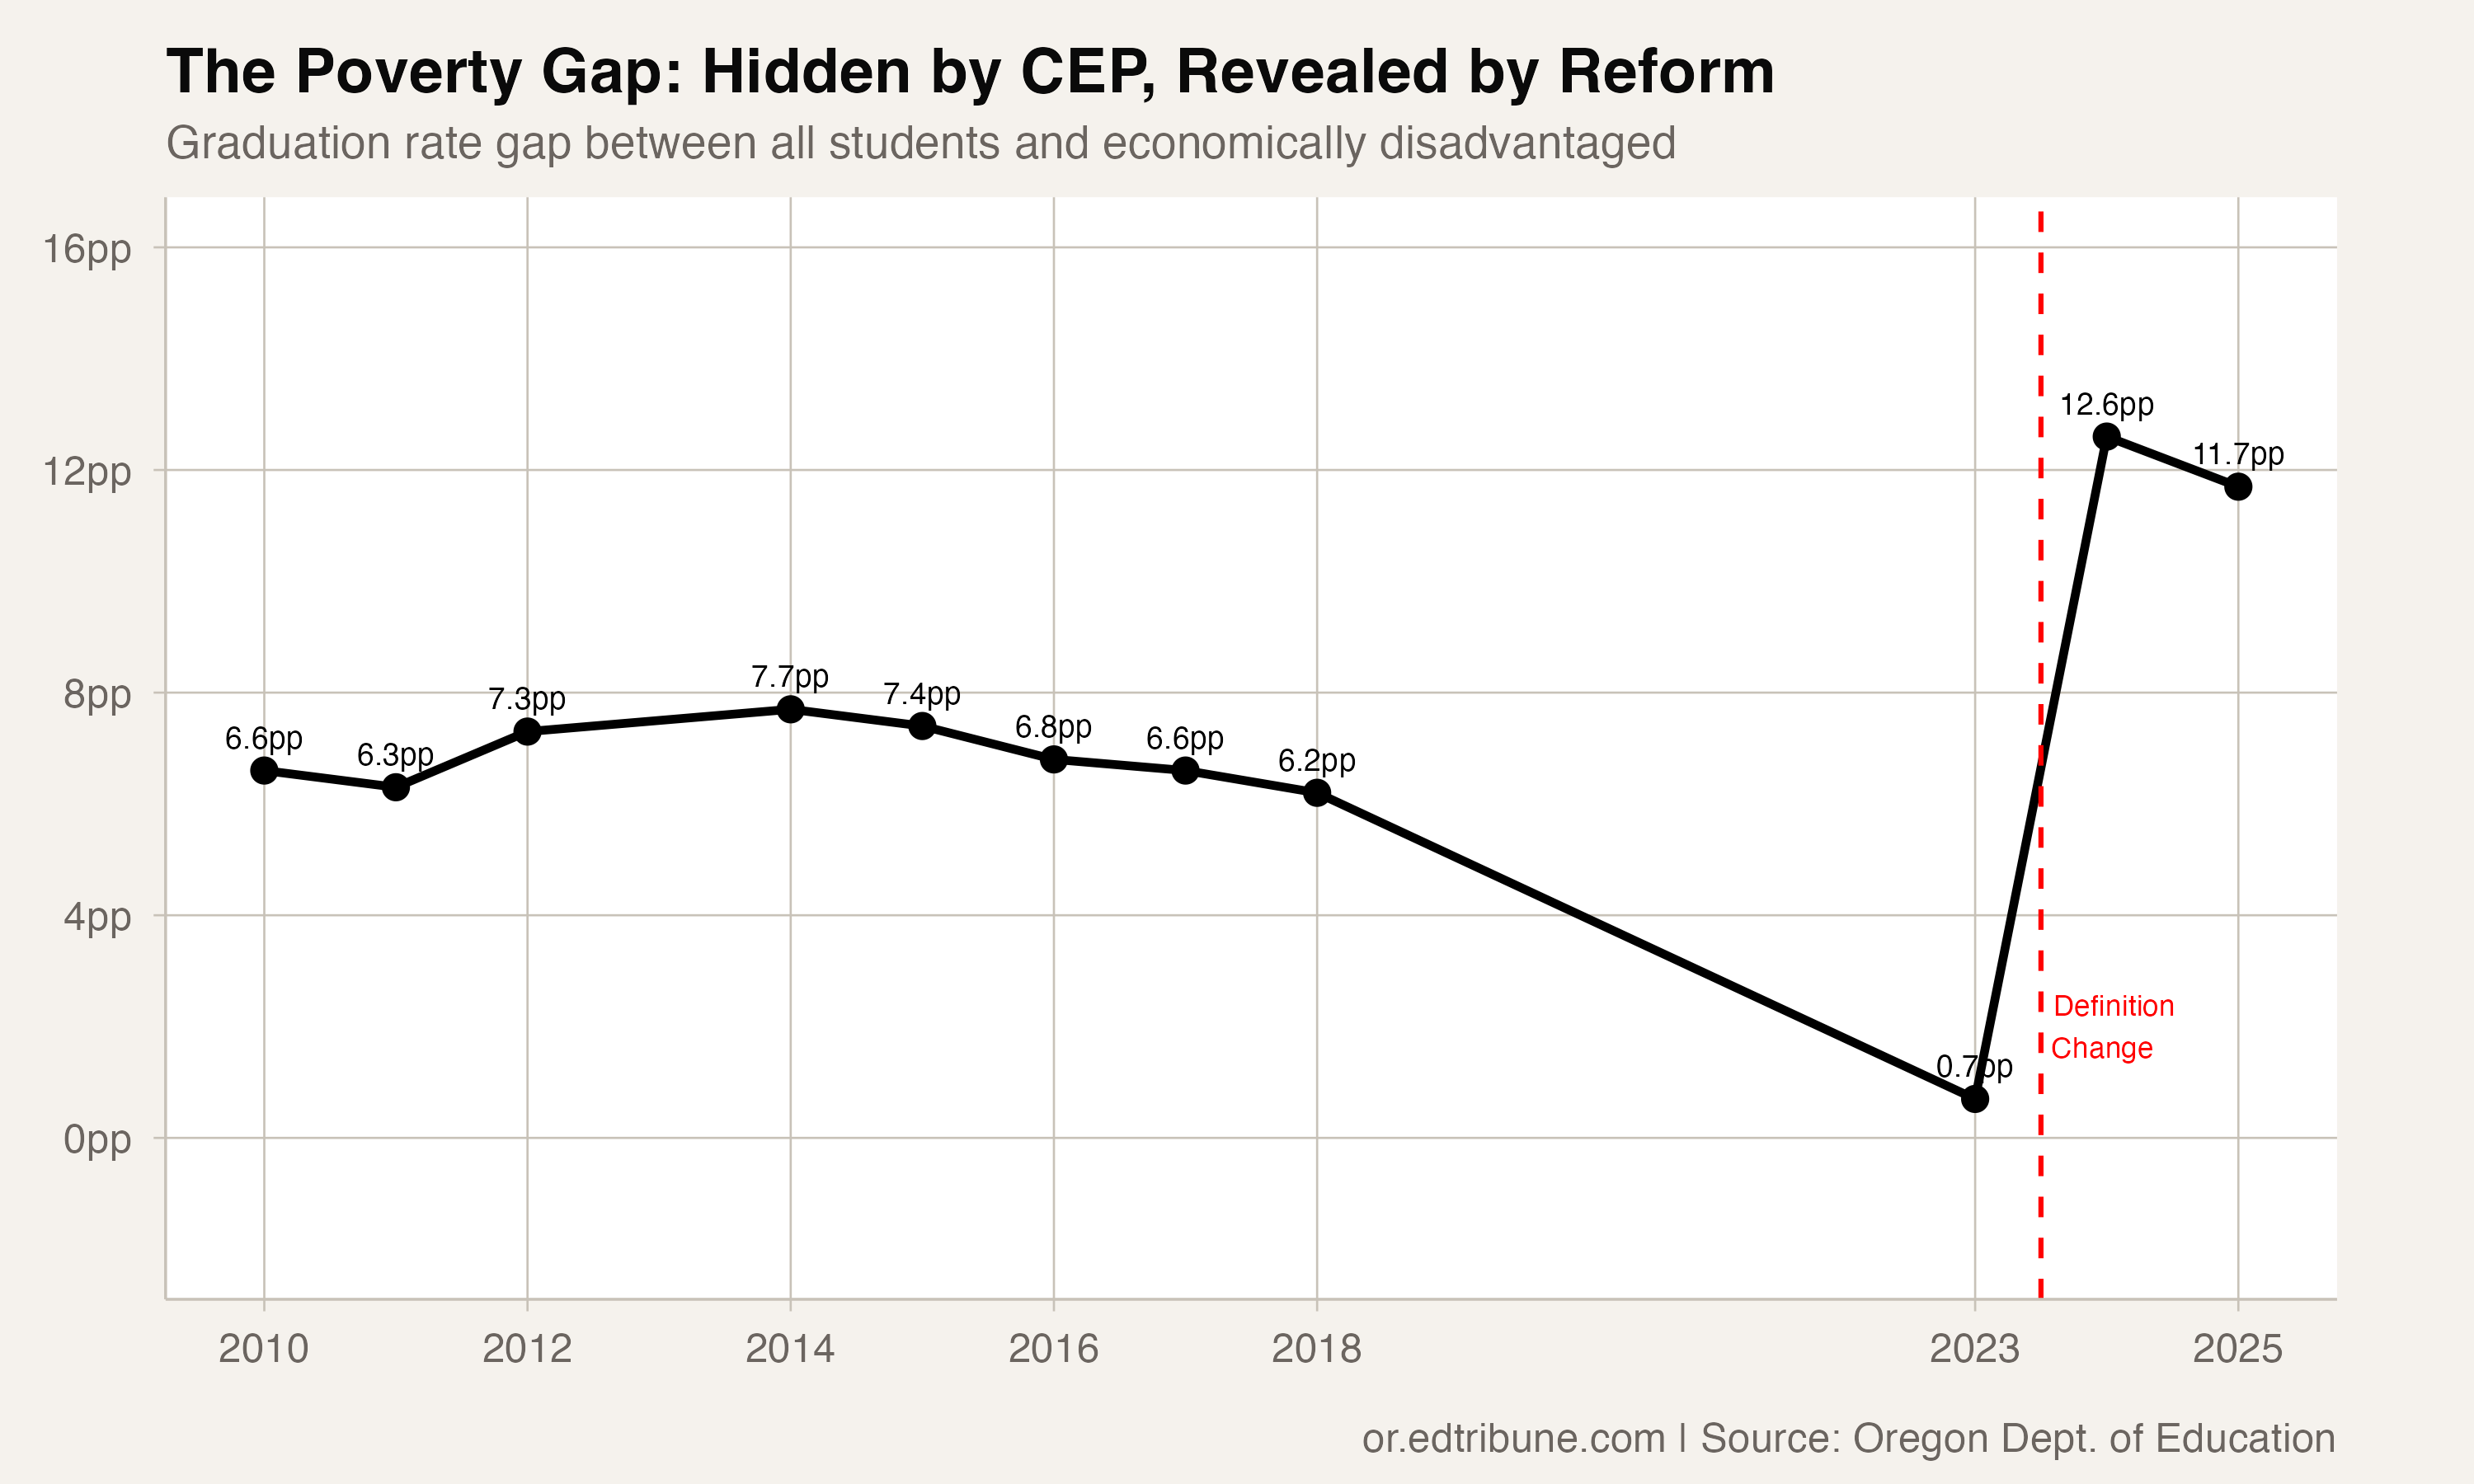
For years, Oregon's data told a reassuring story about economic equity in graduation. The gap between students classified as economically disadvantaged and the state average was small and shrinking. By 2023, it had nearly vanished: 80.7% for economically disadvantaged students versus 81.3% for all students. A gap of just 0.6 percentage points.
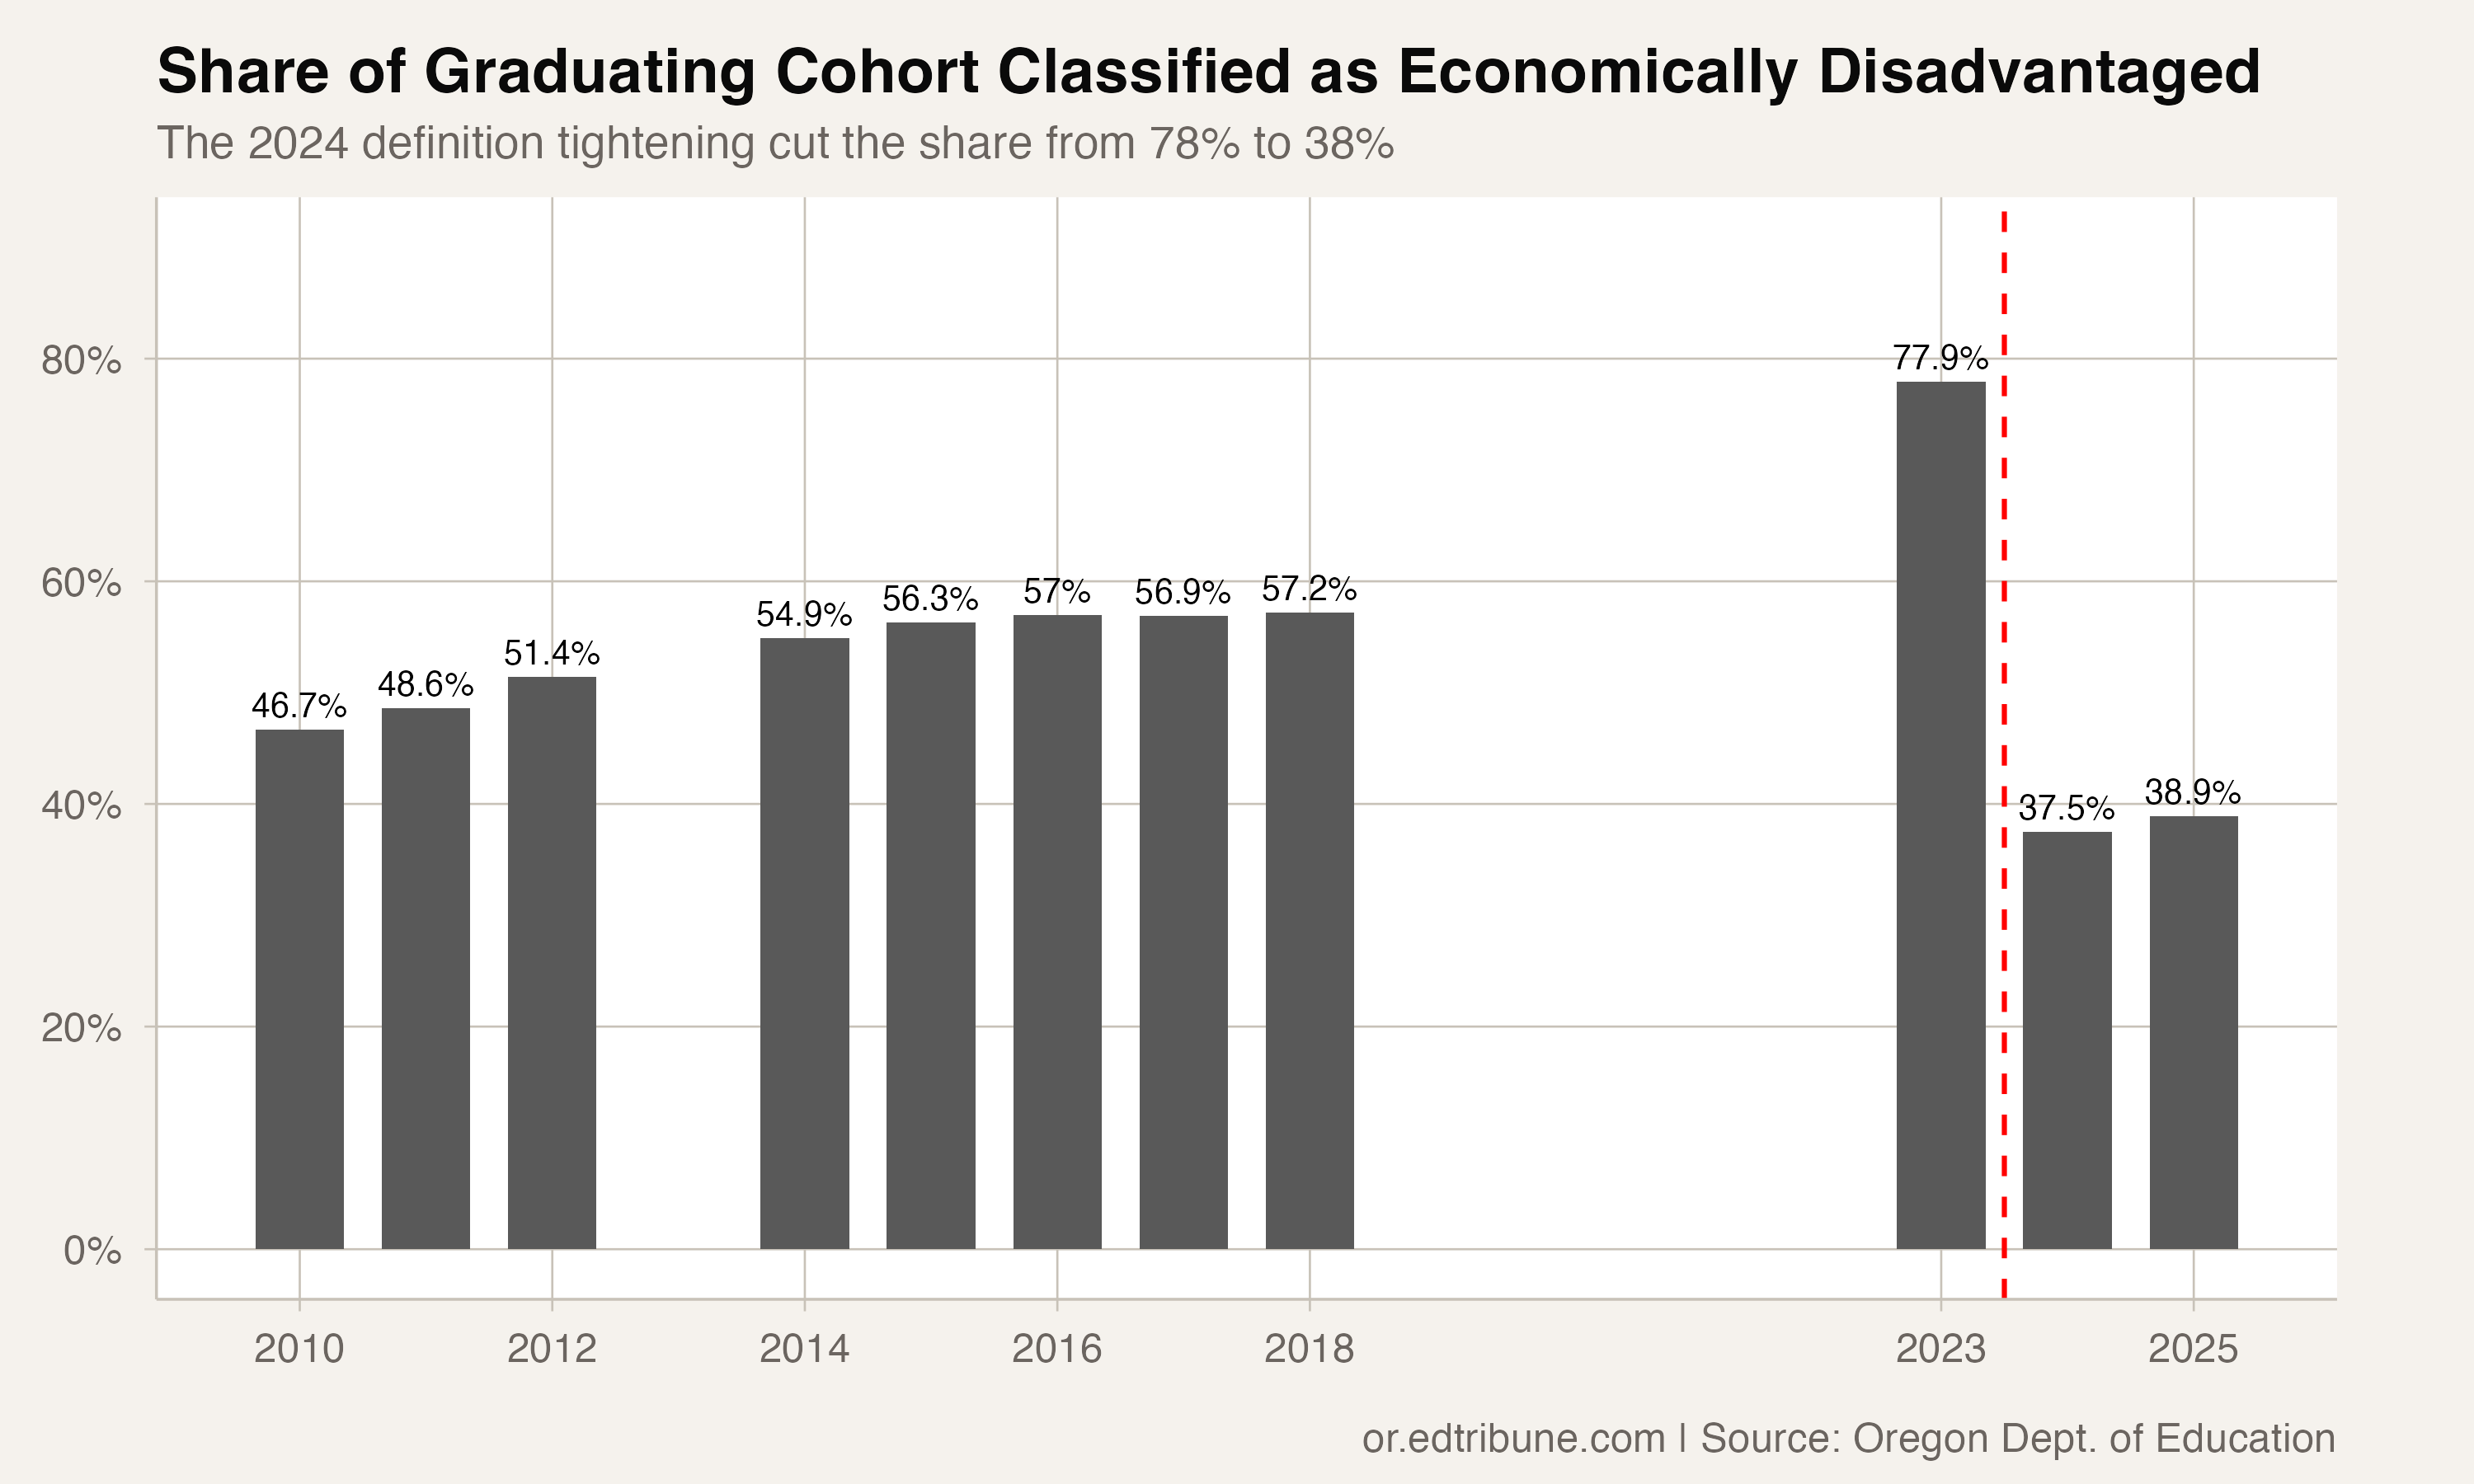
The problem was that 77.9% of the entire graduating cohort was classified as economically disadvantaged.
When nearly four out of five students carry the label, the category ceases to mean anything. You are not measuring disadvantaged students. You are measuring almost all students.
What happened in 2024
Oregon tightened its definition of economic disadvantage between the Class of 2023 and the Class of 2024. The share of the graduating cohort classified as economically disadvantaged dropped from 77.9% to 37.5%, a decline of more than 40 percentage points.
The graduation rate for this newly defined group dropped with it: from 80.7% to 69.2%.
The gap to the state average jumped from 0.7 points to 12.6 points overnight.
The CEP mechanism
The inflated classification stemmed from the Community Eligibility Provision, a federal school meal program that allows entire schools and districts to provide free meals to all students if a threshold of directly certified low-income students is met. Under CEP, schools often classified their entire enrollment as economically disadvantaged for state reporting purposes, regardless of individual family income.
The result was a classification so broad that it was functionally meaningless. When Oregon reported that 80.7% of economically disadvantaged students graduated on time, it was reporting something very close to the overall graduation rate because the two populations were nearly identical.
The gap was there all along
The 2024-2025 data under the tighter definition reveals what the CEP-era numbers obscured. Students who are genuinely economically disadvantaged -- roughly 37-38% of the cohort, not 78% -- graduate at rates substantially below their peers.
For the Class of 2025, the gap stands at 11.7 percentage points. Economically disadvantaged students graduated at 71.3%, compared to 83.0% for all students. The gap narrowed by about a point from 2024 to 2025, but whether that represents the beginning of a trend or normal year-to-year variation requires more data to determine.
The pre-definition-change era (2010 through 2018) showed gaps in the 6 to 8 percentage point range. But those numbers, too, were inflated by CEP classifications, just to a lesser degree than the 2023 peak. The true poverty gap in graduation was likely larger than what the old data suggested throughout the entire period.
Why this matters
The practical consequence is that Oregon spent years without usable data on one of the most important equity questions in education: how much does family income affect whether a student graduates on time?
The answer, now visible in the data, is that it matters considerably. The 11.7-point gap for the Class of 2025 means that a student from a low-income family is about 14% less likely to graduate in four years than the average student. Applied to the roughly 18,000 economically disadvantaged students in the 2025 cohort, the gap represents approximately 2,100 students who would have graduated if their rate matched the state average.
The corrected definition does not make the gap worse. It makes the gap visible. Oregon can now measure what it is actually trying to change.
Data source
Four-year adjusted cohort graduation rate data from the Oregon Department of Education. Data covers the Class of 2010 through the Class of 2025, excluding 2013 and 2019-2022. The economically disadvantaged definition changed between the Class of 2023 and the Class of 2024, reducing the share of the cohort classified as disadvantaged from 77.9% to 37.5%. Trends should not be drawn across this break. Oregon's essential skills testing requirement has been suspended through 2027-28.
Detailed code that reproduces the analysis and figures in this article is available exclusively to EdTribune subscribers.
Discussion
Sign in to join the discussion.
Loading comments...