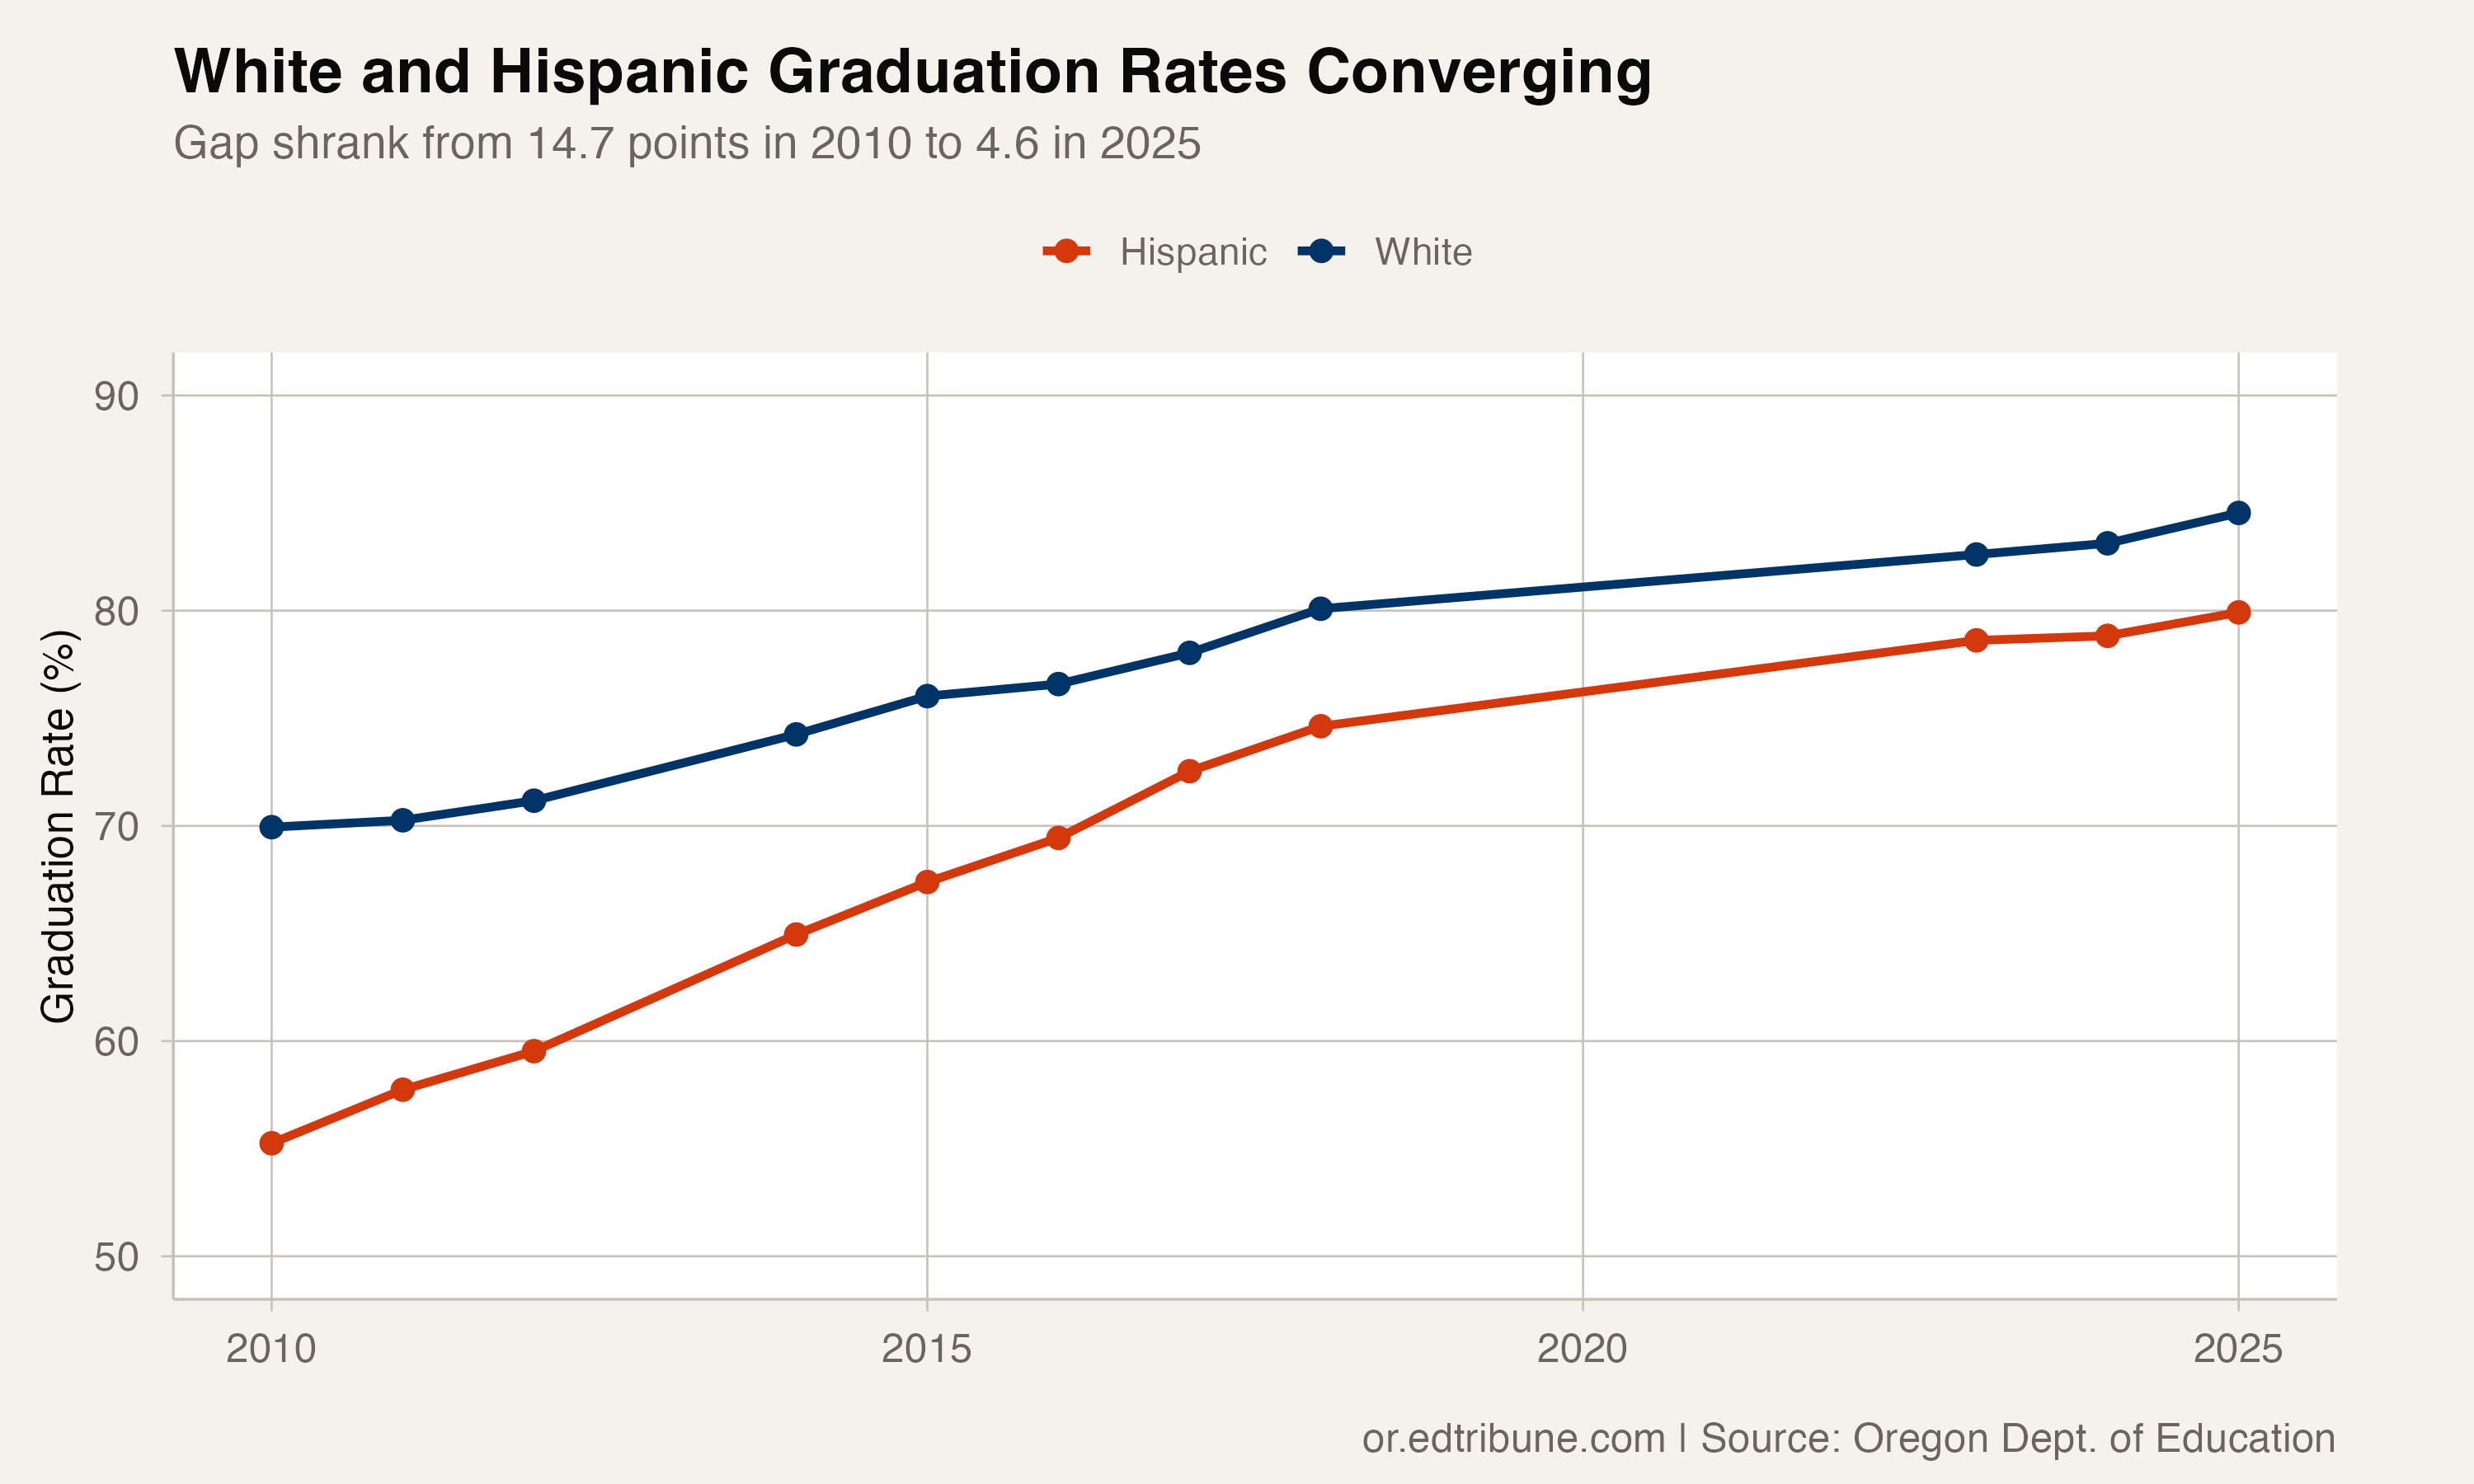
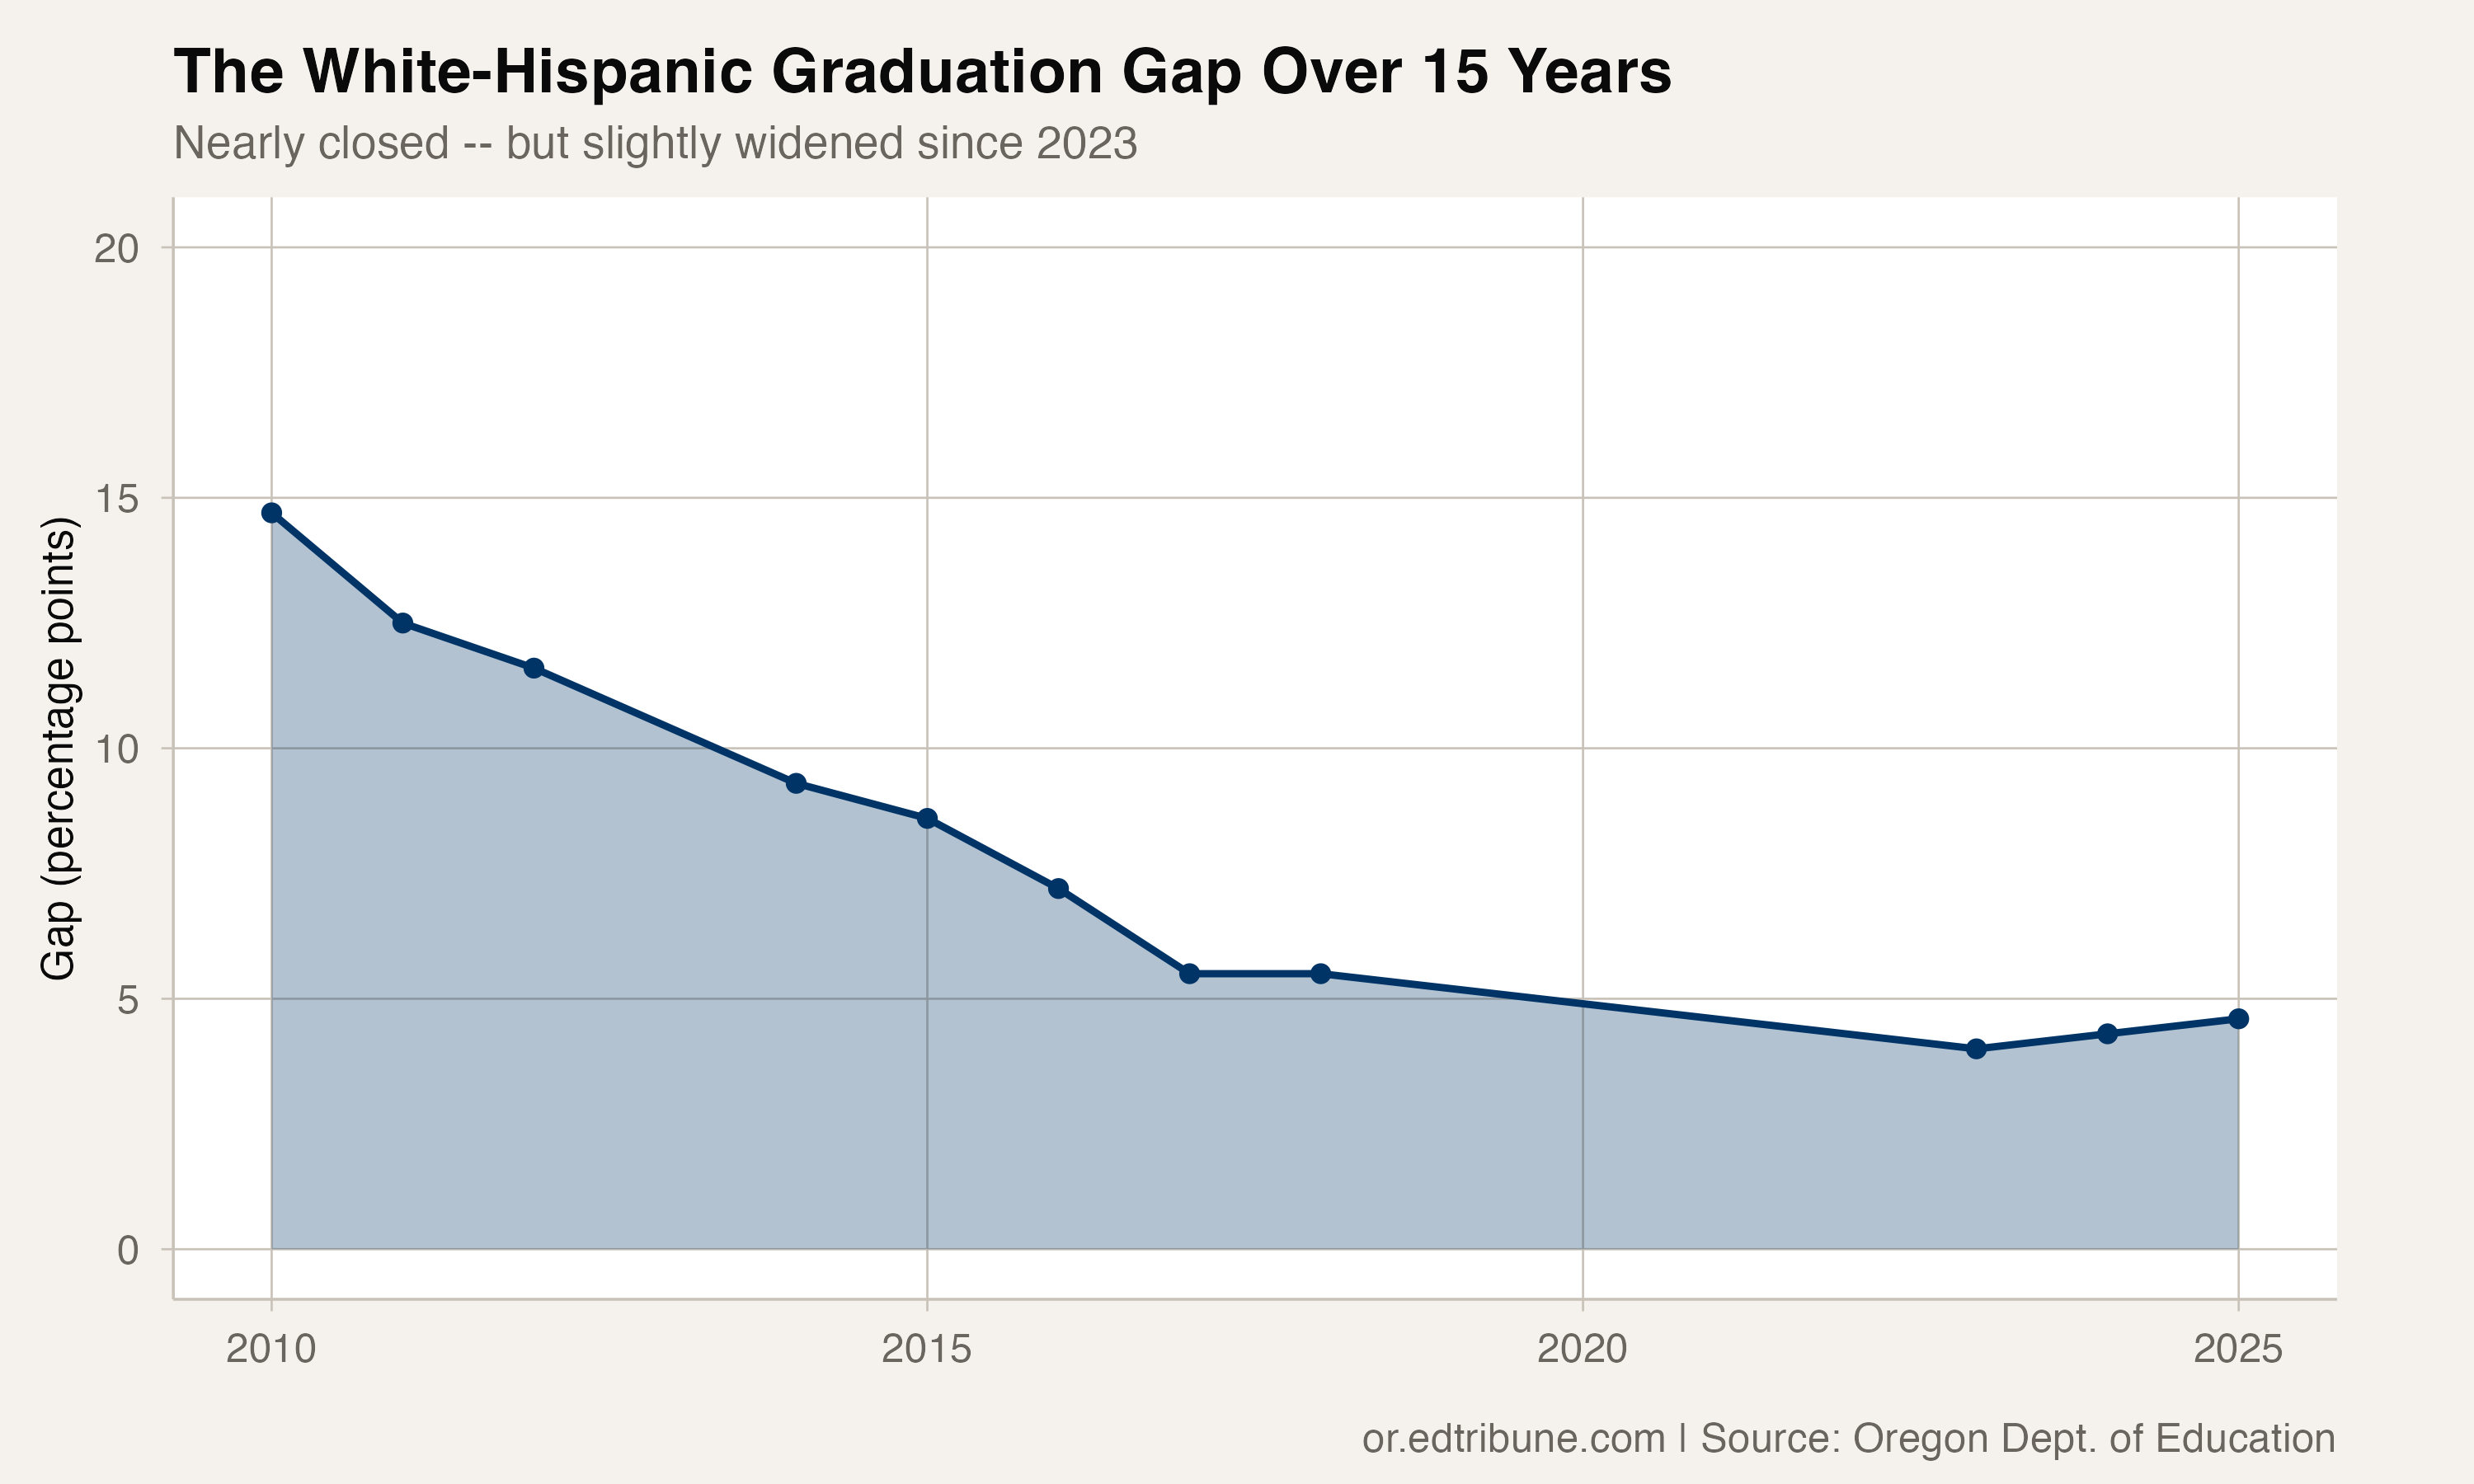
The white-Hispanic graduation gap in Oregon was 14.7 points in 2010. For the Class of 2025, it is 4.6.
Hispanic students drove the convergence. Their graduation rate climbed 24.7 points over 15 years, from 55.2% to 79.9%, nearly doubling the 14.6-point gain white students made over the same period. White students now graduate at 84.5%.
A Genuine Success Story — With a Caveat
The numbers tell a clear story. Oregon's Hispanic graduation rate has improved in every year with available data, rising from 55.2% in 2010 to 79.9% in 2025. The growth was steady, adding roughly 1.5 to 2 points per year without the plateaus that often stall equity progress.
| Year | Hispanic | White | Gap |
|---|---|---|---|
| 2010 | 55.2% | 69.9% | 14.7 |
| 2014 | 65.0% | 74.2% | 9.2 |
| 2018 | 74.6% | 80.1% | 5.5 |
| 2023 | 78.6% | 82.6% | 4.0 |
| 2025 | 79.9% | 84.5% | 4.6 |
The caveat is timing. The gap hit its narrowest point of 4.0 percentage points in 2023 and has since widened slightly, to 4.3 in 2024 and 4.6 in 2025. This may be statistical noise. It may also signal that the easiest gains have been made and the remaining gap will prove more stubborn.
The Districts Where Hispanic Students Graduate at Higher Rates
In 23 Oregon districts where both groups have at least 20 students in the graduating cohort, Hispanic students now outpace their white peers. The gaps are not trivial.
Nyssa SD 26↗ET, a small agricultural district in Malheur County near the Idaho border, leads the list: 94.6% of Hispanic students graduated versus 70.0% of white students, a 24.6-point advantage for Hispanic students. In North Marion SD 15↗ET, the margin is 15.9 points (81.3% versus 65.4%).
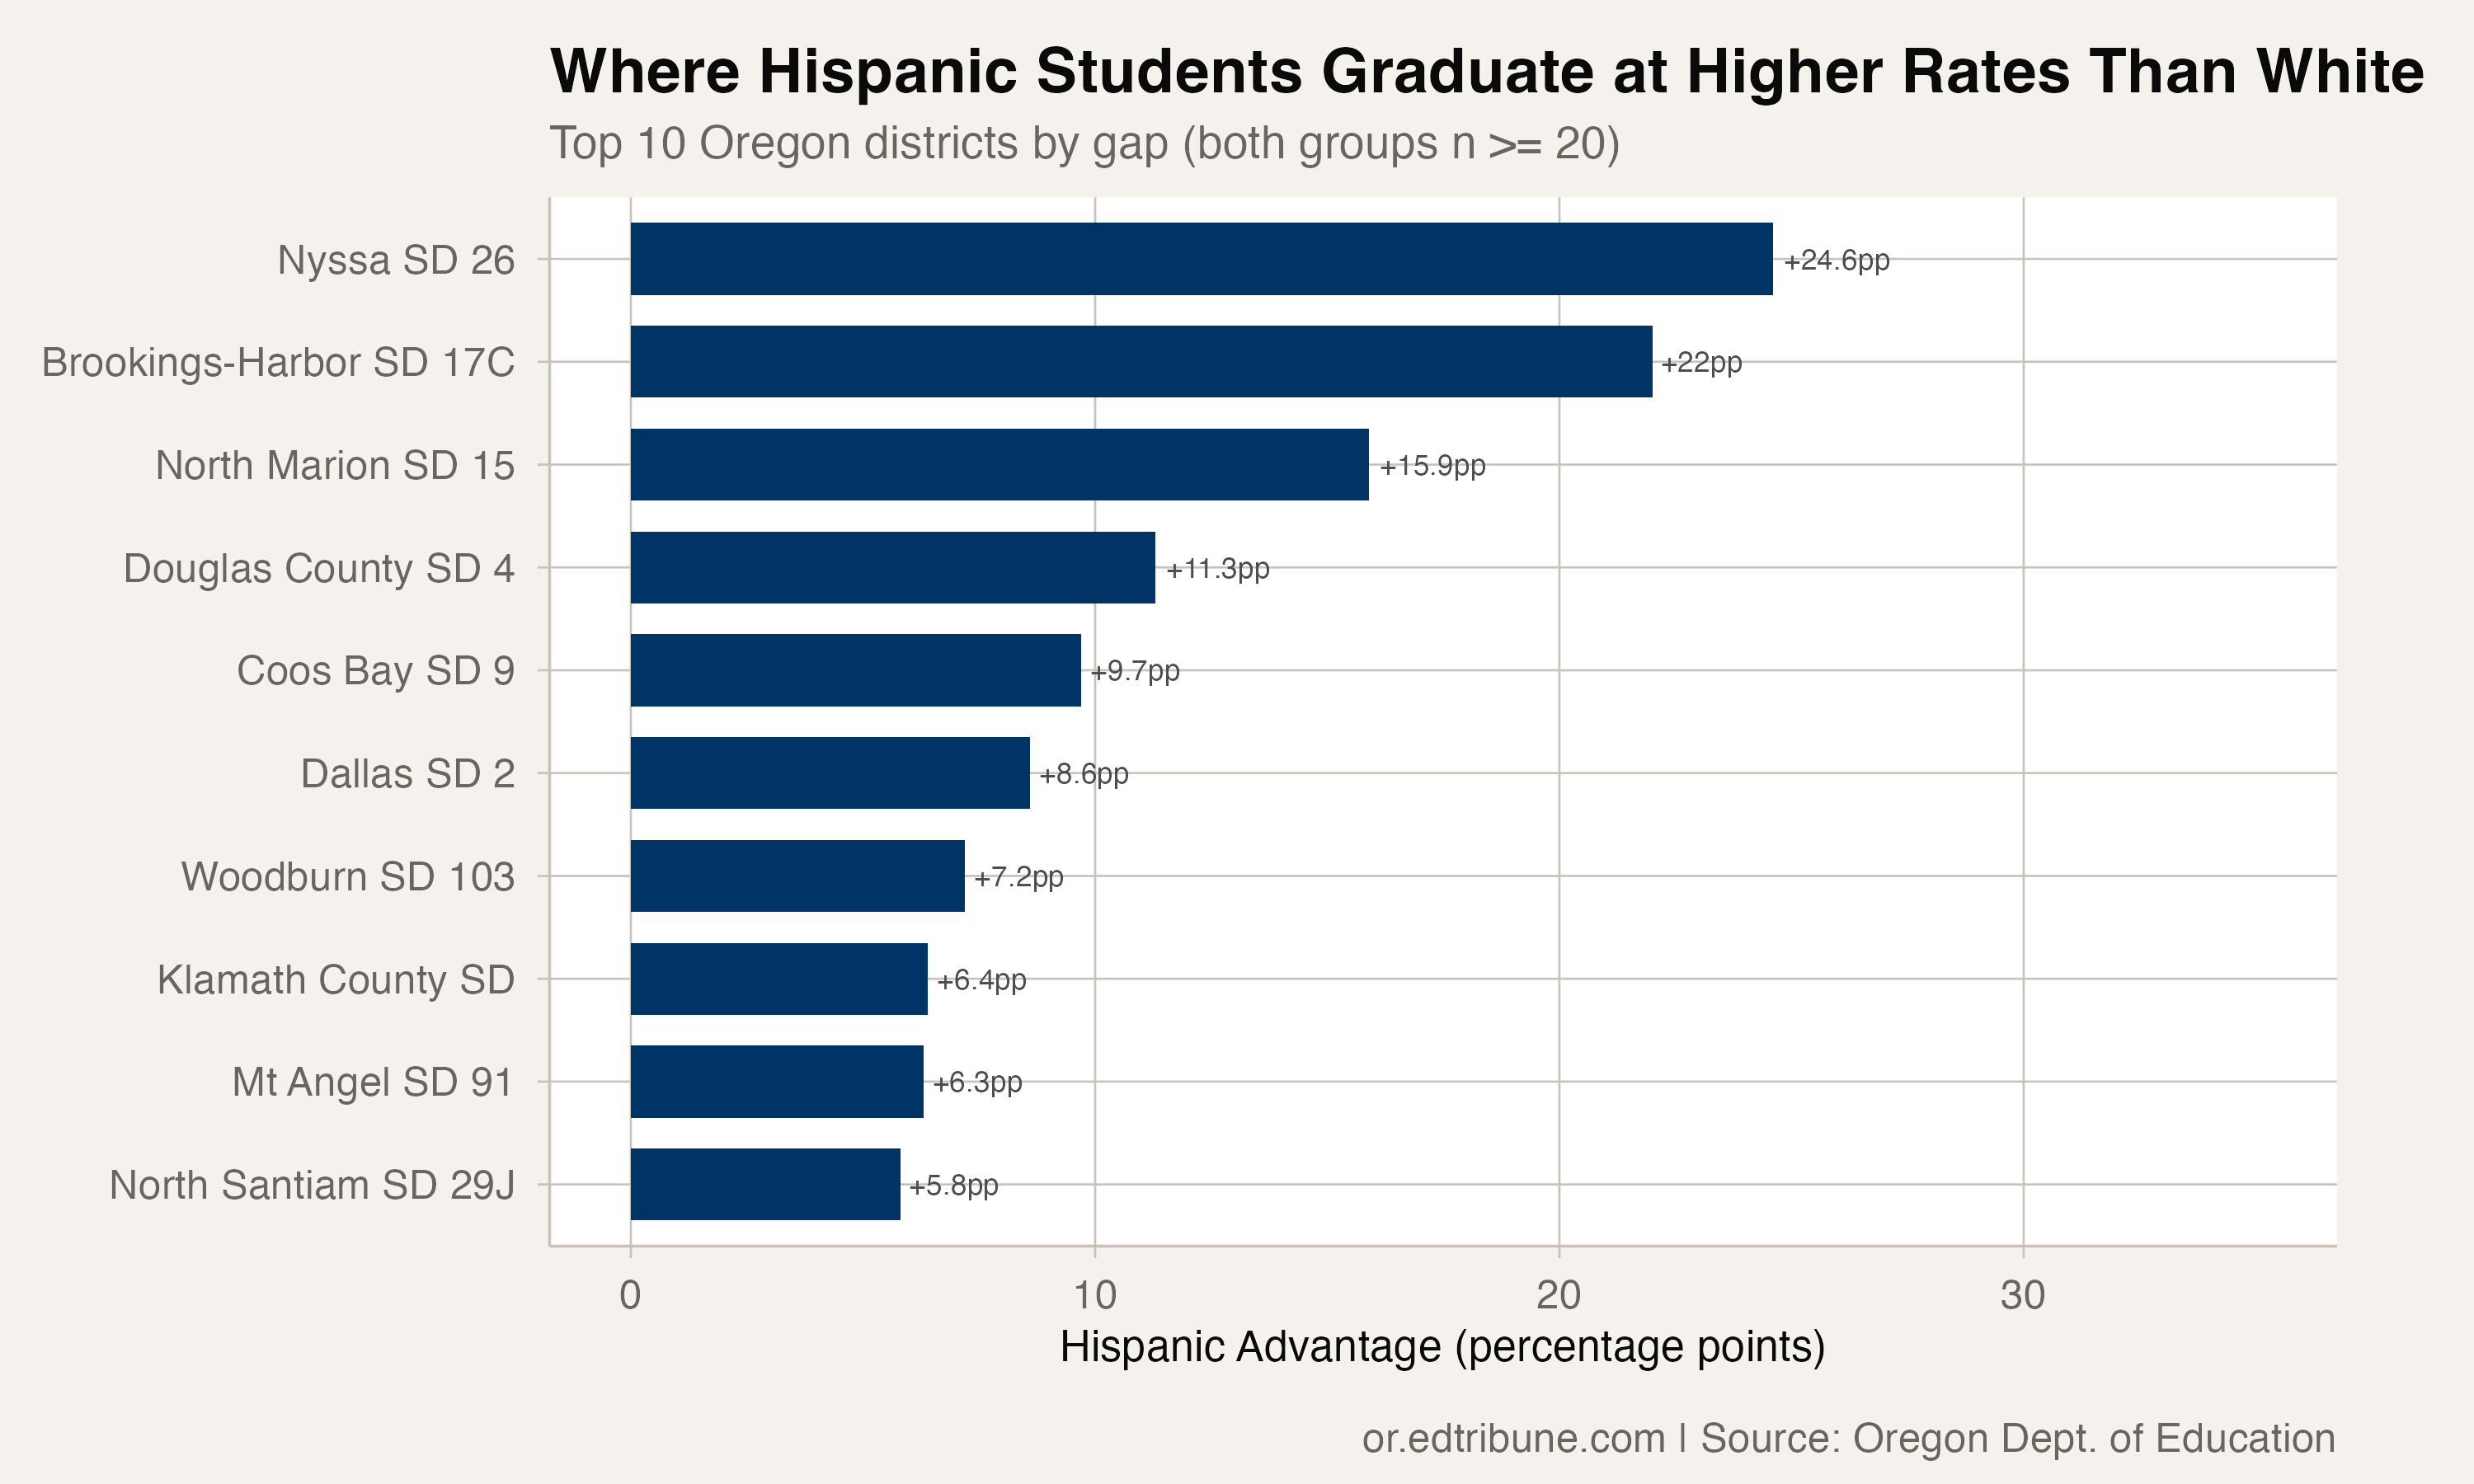
Many of these districts share a profile: agricultural communities in the Willamette Valley and eastern Oregon where Hispanic families have deep generational roots. Woodburn SD 103↗ET, where 431 Hispanic students graduated at 78.0% versus 70.8% for white students, is Oregon's most prominent example. The district is majority-Hispanic and has invested heavily in bilingual education and community engagement.
A Growing Share of the Student Body
Oregon's Hispanic graduating cohort has grown from 7,937 students in 2010 to 13,018 in 2025, a 64% increase. Hispanic students now represent 26.8% of all Oregon graduates, up from 16.0% fifteen years ago.
This growth makes the gap closure doubly significant. Oregon did not narrow its graduation gap by serving a shrinking population. It did so while the Hispanic student body expanded rapidly, absorbing new immigrants and families with diverse preparation levels.
What Drove the Improvement
No single factor explains a 24.7-point gain across an entire state. Oregon expanded bilingual and dual-language programs during this period, invested in migrant education services, and adopted more flexible graduation pathways. The suspension of the essential skills testing requirement, which affected all students, may have disproportionately helped students still developing English proficiency.
Community organizations, particularly in the Willamette Valley's agricultural regions, have built support networks around Hispanic families that did not exist a generation ago. The connection between school stability, family support, and graduation completion shows up clearly in the data from districts like Nyssa, Woodburn, and North Marion.
The Remaining 4.6 Points
At the current pace, the white-Hispanic graduation gap would close entirely within three to five years. But the slight widening since 2023 suggests this final stretch may require different strategies than the first 10 points.
The students who now fall in the gap are likely those facing the most complex barriers: recent arrivals still acquiring English, students from families with unstable housing or employment, students in districts without strong bilingual infrastructure. Closing the gap fully will require reaching students that existing programs have not yet reached.
Oregon's progress from 14.7 to 4.6 points is real and worth celebrating. Whether the state finishes the job depends on whether it maintains the investment that got it this far.
Data Source
This analysis uses four-year adjusted cohort graduation rate data published by the Oregon Department of Education, covering the Classes of 2010 through 2025 (excluding 2013 and 2019-2022, years when comparable data was not published).
Detailed code that reproduces the analysis and figures in this article is available exclusively to EdTribune subscribers.
Discussion
Sign in to join the discussion.
Loading comments...