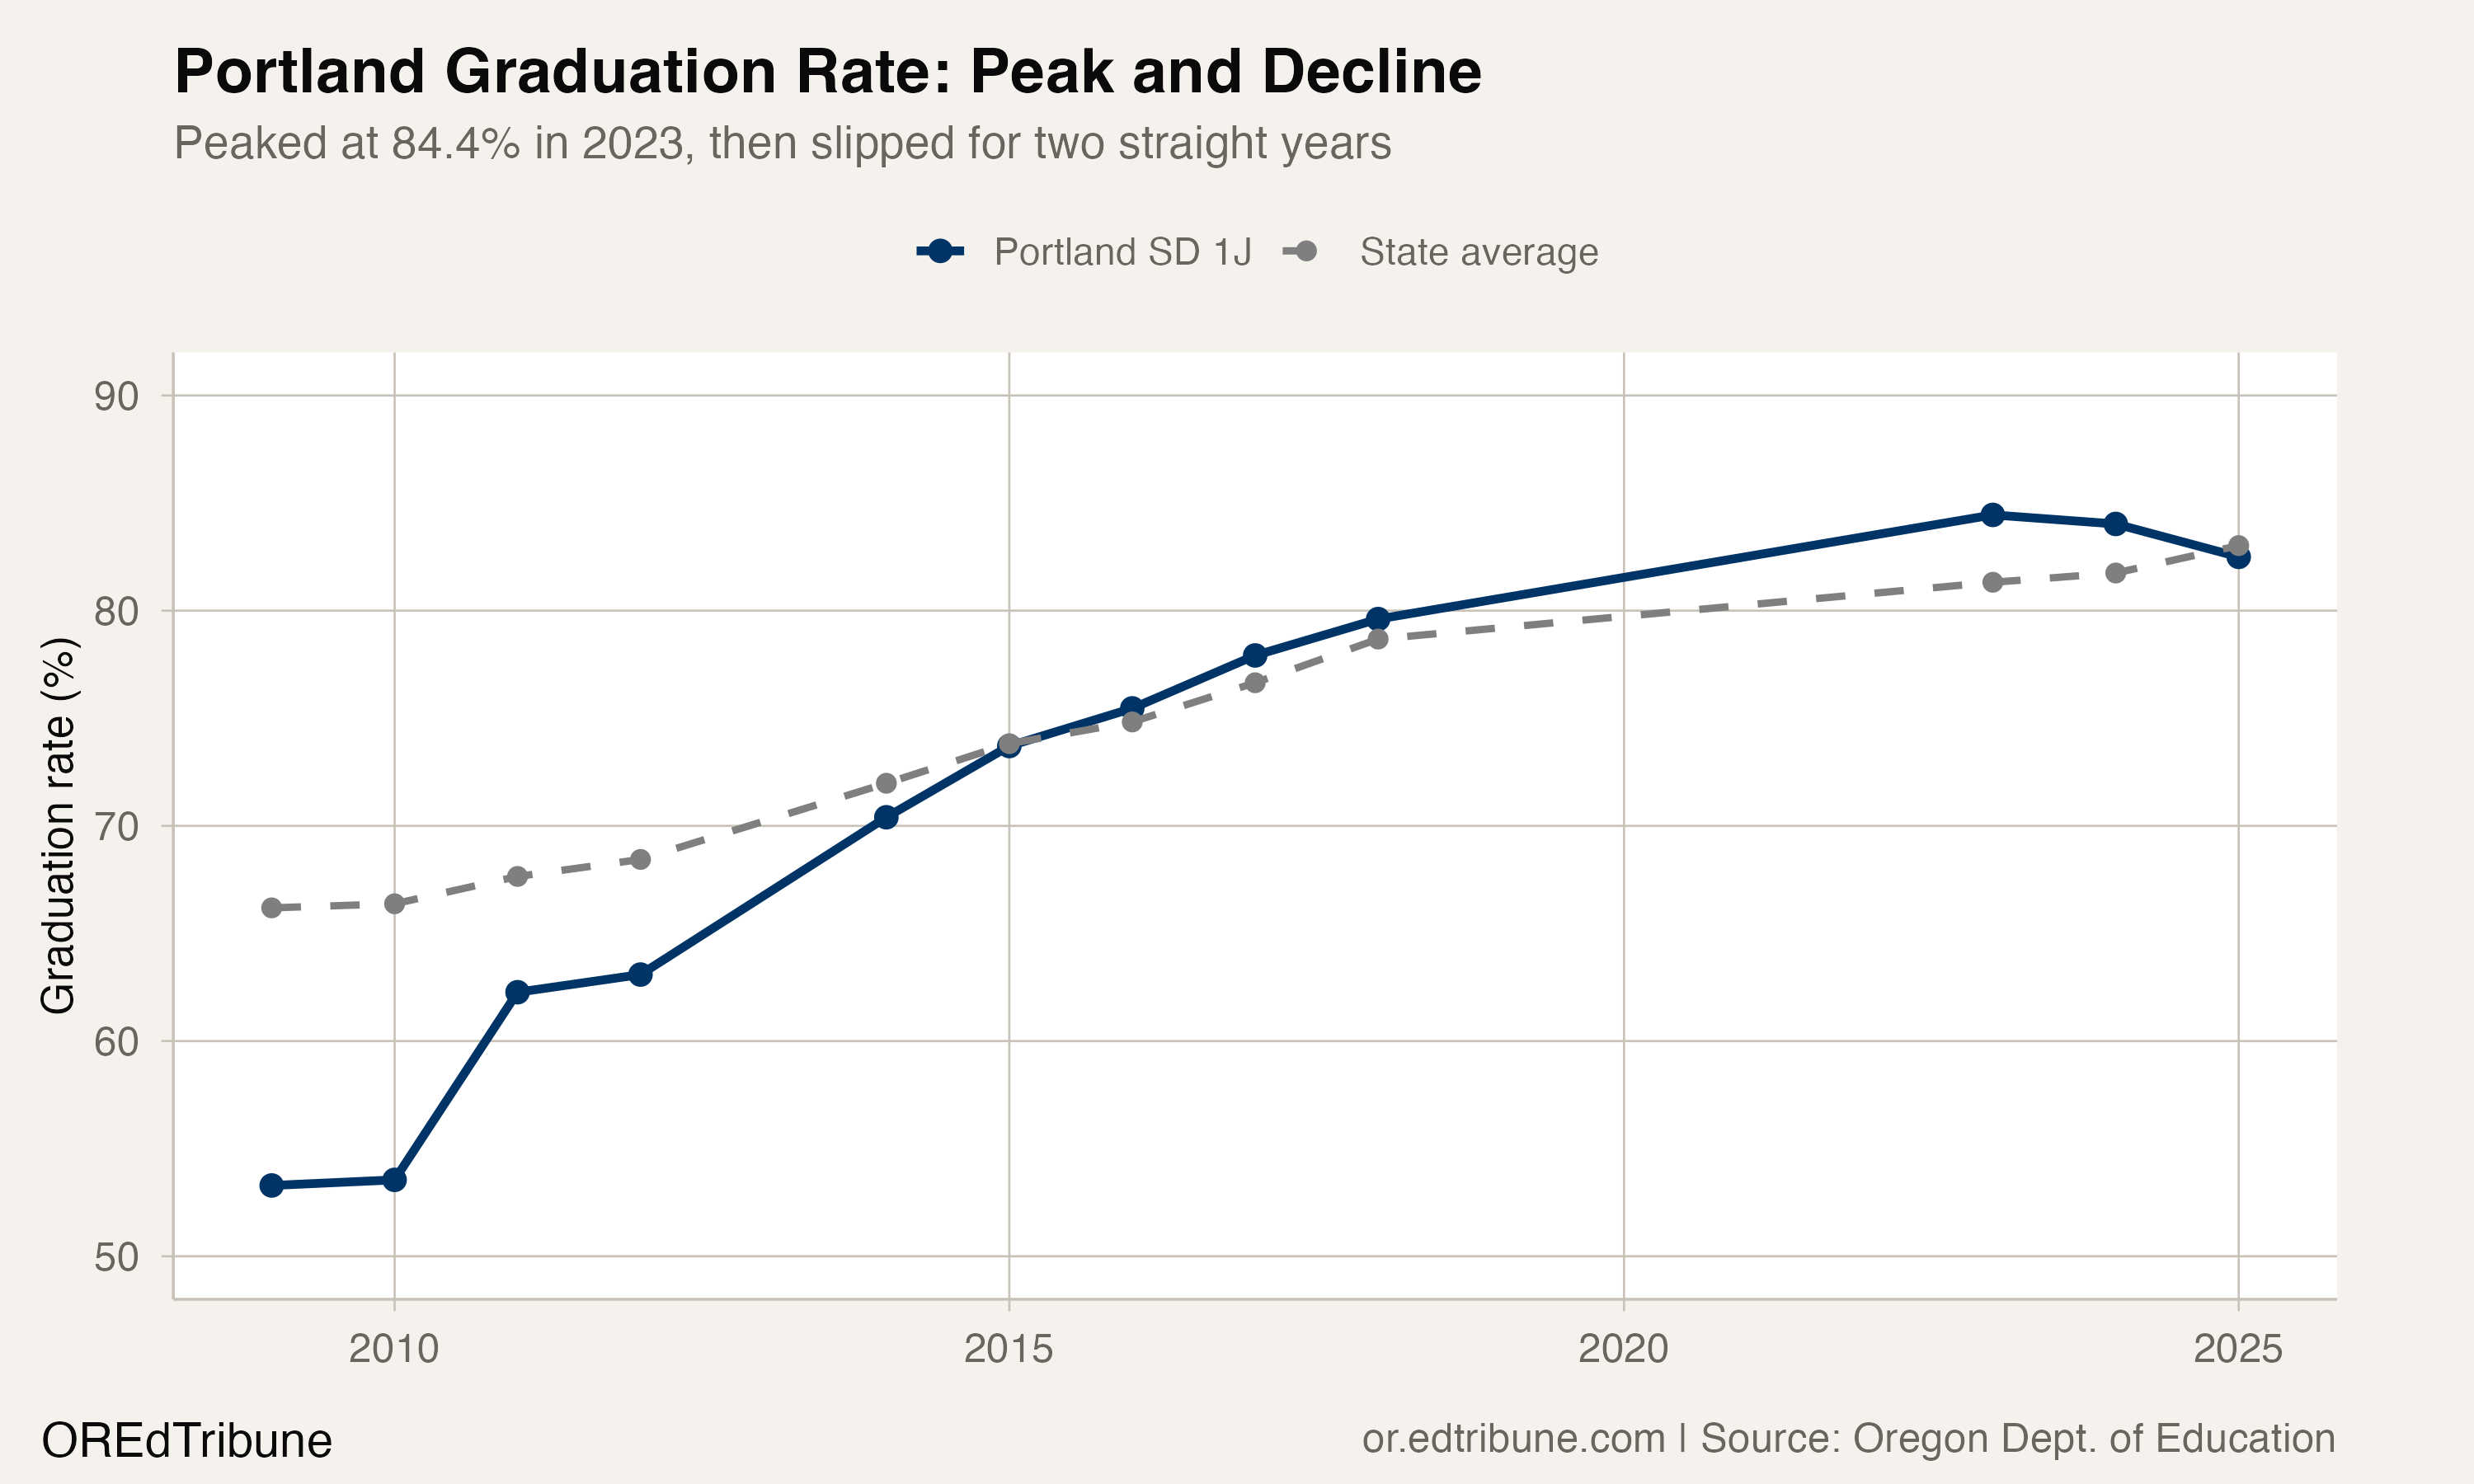
Portland SD 1J↗ET, Oregon's largest district by 2025 graduation cohort, tells two graduation stories. The long arc is a 30.9-point climb: from 53.6% in 2010 to a peak of 84.4% in 2023.
The recent arc is less reassuring. Portland's rate slipped in each of the past two published years, to 84.0% in 2024 and 82.5% in 2025. Oregon's overall rate continued climbing to 83.0%, meaning Portland fell from above the state average to 0.5 points below it.
The Long Climb
Portland's climb from 2010 to 2023 was one of the steepest among Oregon's large districts. Among districts with at least 500 students in both cohorts, Portland's 30.9-point gain ranked second.
Across the 2010-to-2023 span, the improvement averaged about 2.4 percentage points per year. By the next published data point after the 2019-2022 reporting gap, Portland crested at 84.4% with the Class of 2023. During that climb, Portland went from 12.8 points below the state average to 3.1 points above it.
The Dip
A two-year decline of 1.9 points is not, by itself, a crisis. It is small in absolute terms. It also happened while Portland produced 3,132 graduates in 2025, the highest graduate count in the district's available data, from a cohort of 3,797 students.
That is context, not direct evidence that cohort size caused the decline. But the timing matters. As 37 Oregon districts with 2025 cohorts of at least 50 students set all-time high graduation rates, Portland went the other direction. The district's rate fell below the state average for the first published class since 2015.
The Racial Gaps Behind the Headline
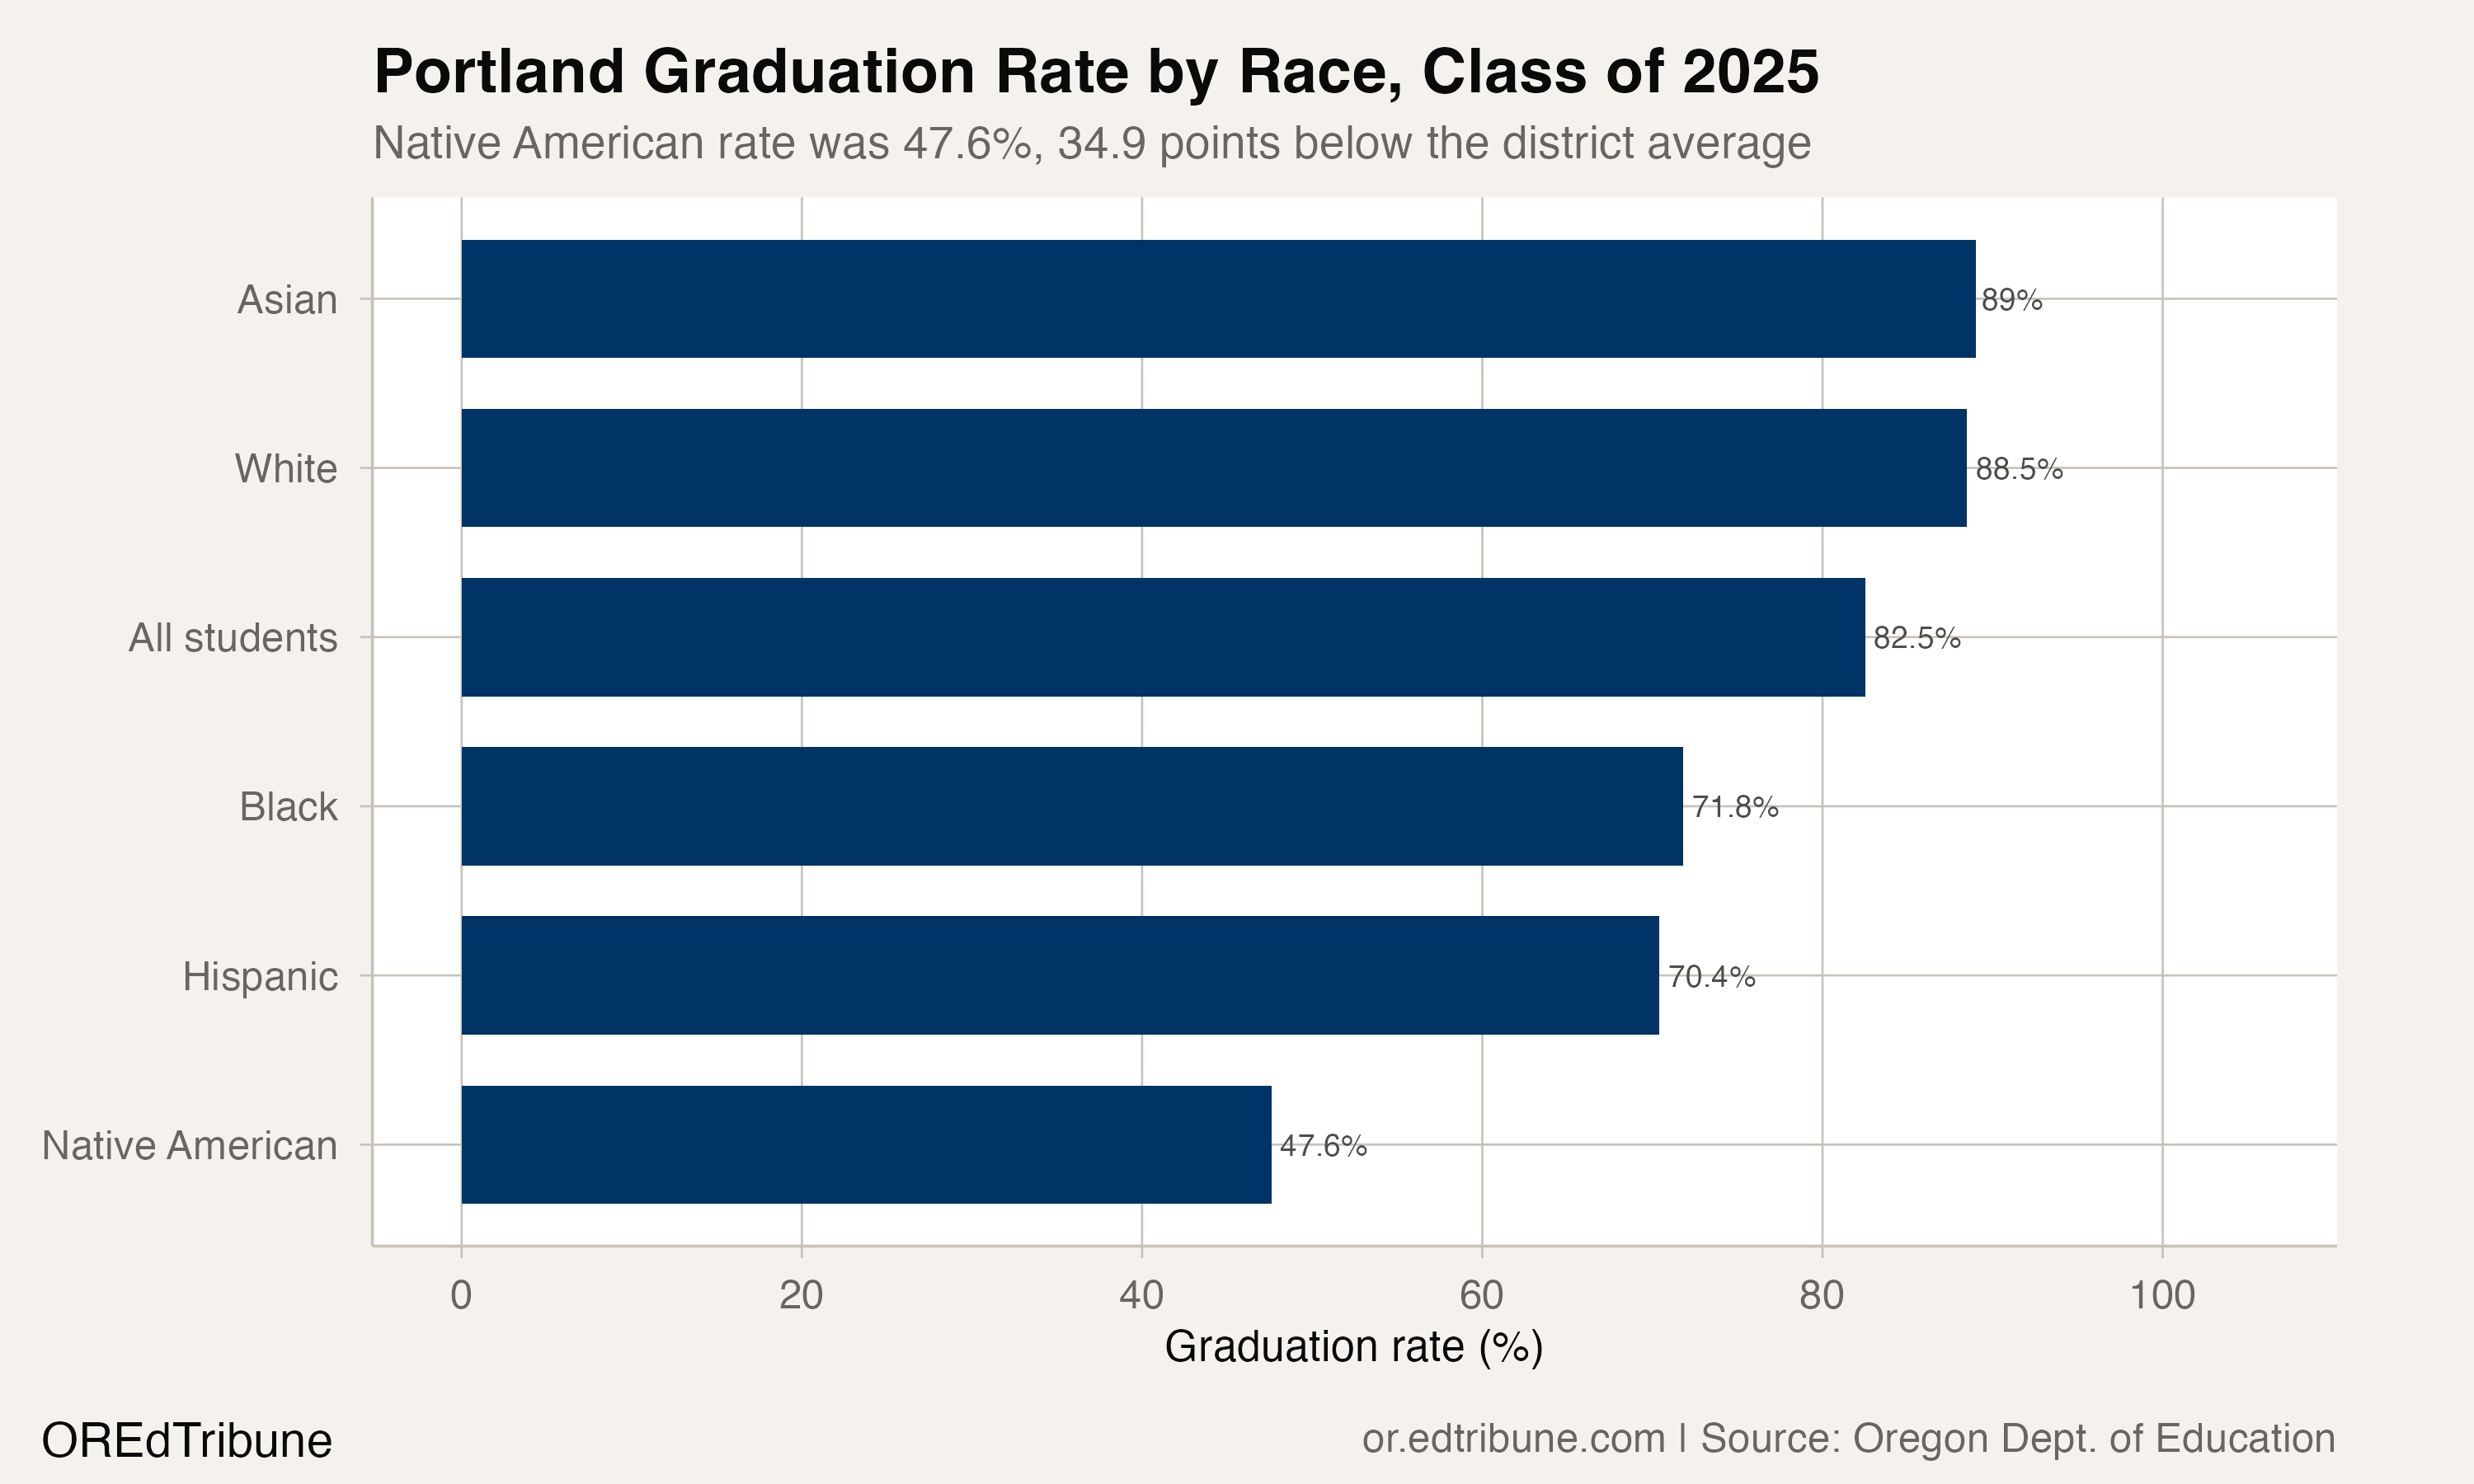
Portland's 82.5% overall rate conceals wide disparities across racial groups.
| Group | 2010 Rate | 2025 Rate | Gain | Gap to Average |
|---|---|---|---|---|
| White | 61.5% | 88.5% | +27.0 | +6.0 |
| Asian | 61.8% | 89.0% | +27.2 | +6.5 |
| Black | 45.8% | 71.8% | +26.0 | -10.7 |
| Hispanic | 34.4% | 70.4% | +36.0 | -12.1 |
| Native American | 36.2% | 47.6% | +11.4 | -34.9 |
Hispanic students made the largest absolute gains among the racial groups listed here, 36.0 points, but still graduated at 70.4% in 2025, 12.1 points below the district average. Black students follow a similar pattern: a 26.0-point gain that still leaves a 10.7-point gap.
The starkest gap is for Native American students. At 47.6%, fewer than half of Portland's Native American students graduated on time. That exact rate repeated in 2023, 2024, and 2025, with 10 graduates out of a 21-student cohort each year.
Counts And Rates
Portland's graduating cohort expanded from 3,400 students in 2012 to 3,797 in 2025. Its graduate count reached 3,132, the highest in the district's available data. Those facts do not erase the dip in the rate; they show why counts and rates can tell different parts of the same story.
The district still faces persistent racial gaps that its overall number can obscure. Among Oregon districts with at least 20 Native American students in the 2025 cohort, Portland had the lowest Native American graduation rate.
Detailed code that reproduces the analysis and figures in this article is available exclusively to EdTribune subscribers.
Discussion
Sign in to join the discussion.
Loading comments...