Oregon's statewide graduation rate has never been higher. For the Class of 2025, 83.0% of students earned a diploma within four years, capping a 15-year climb from 66.4%.
Fifteen districts did not come along.
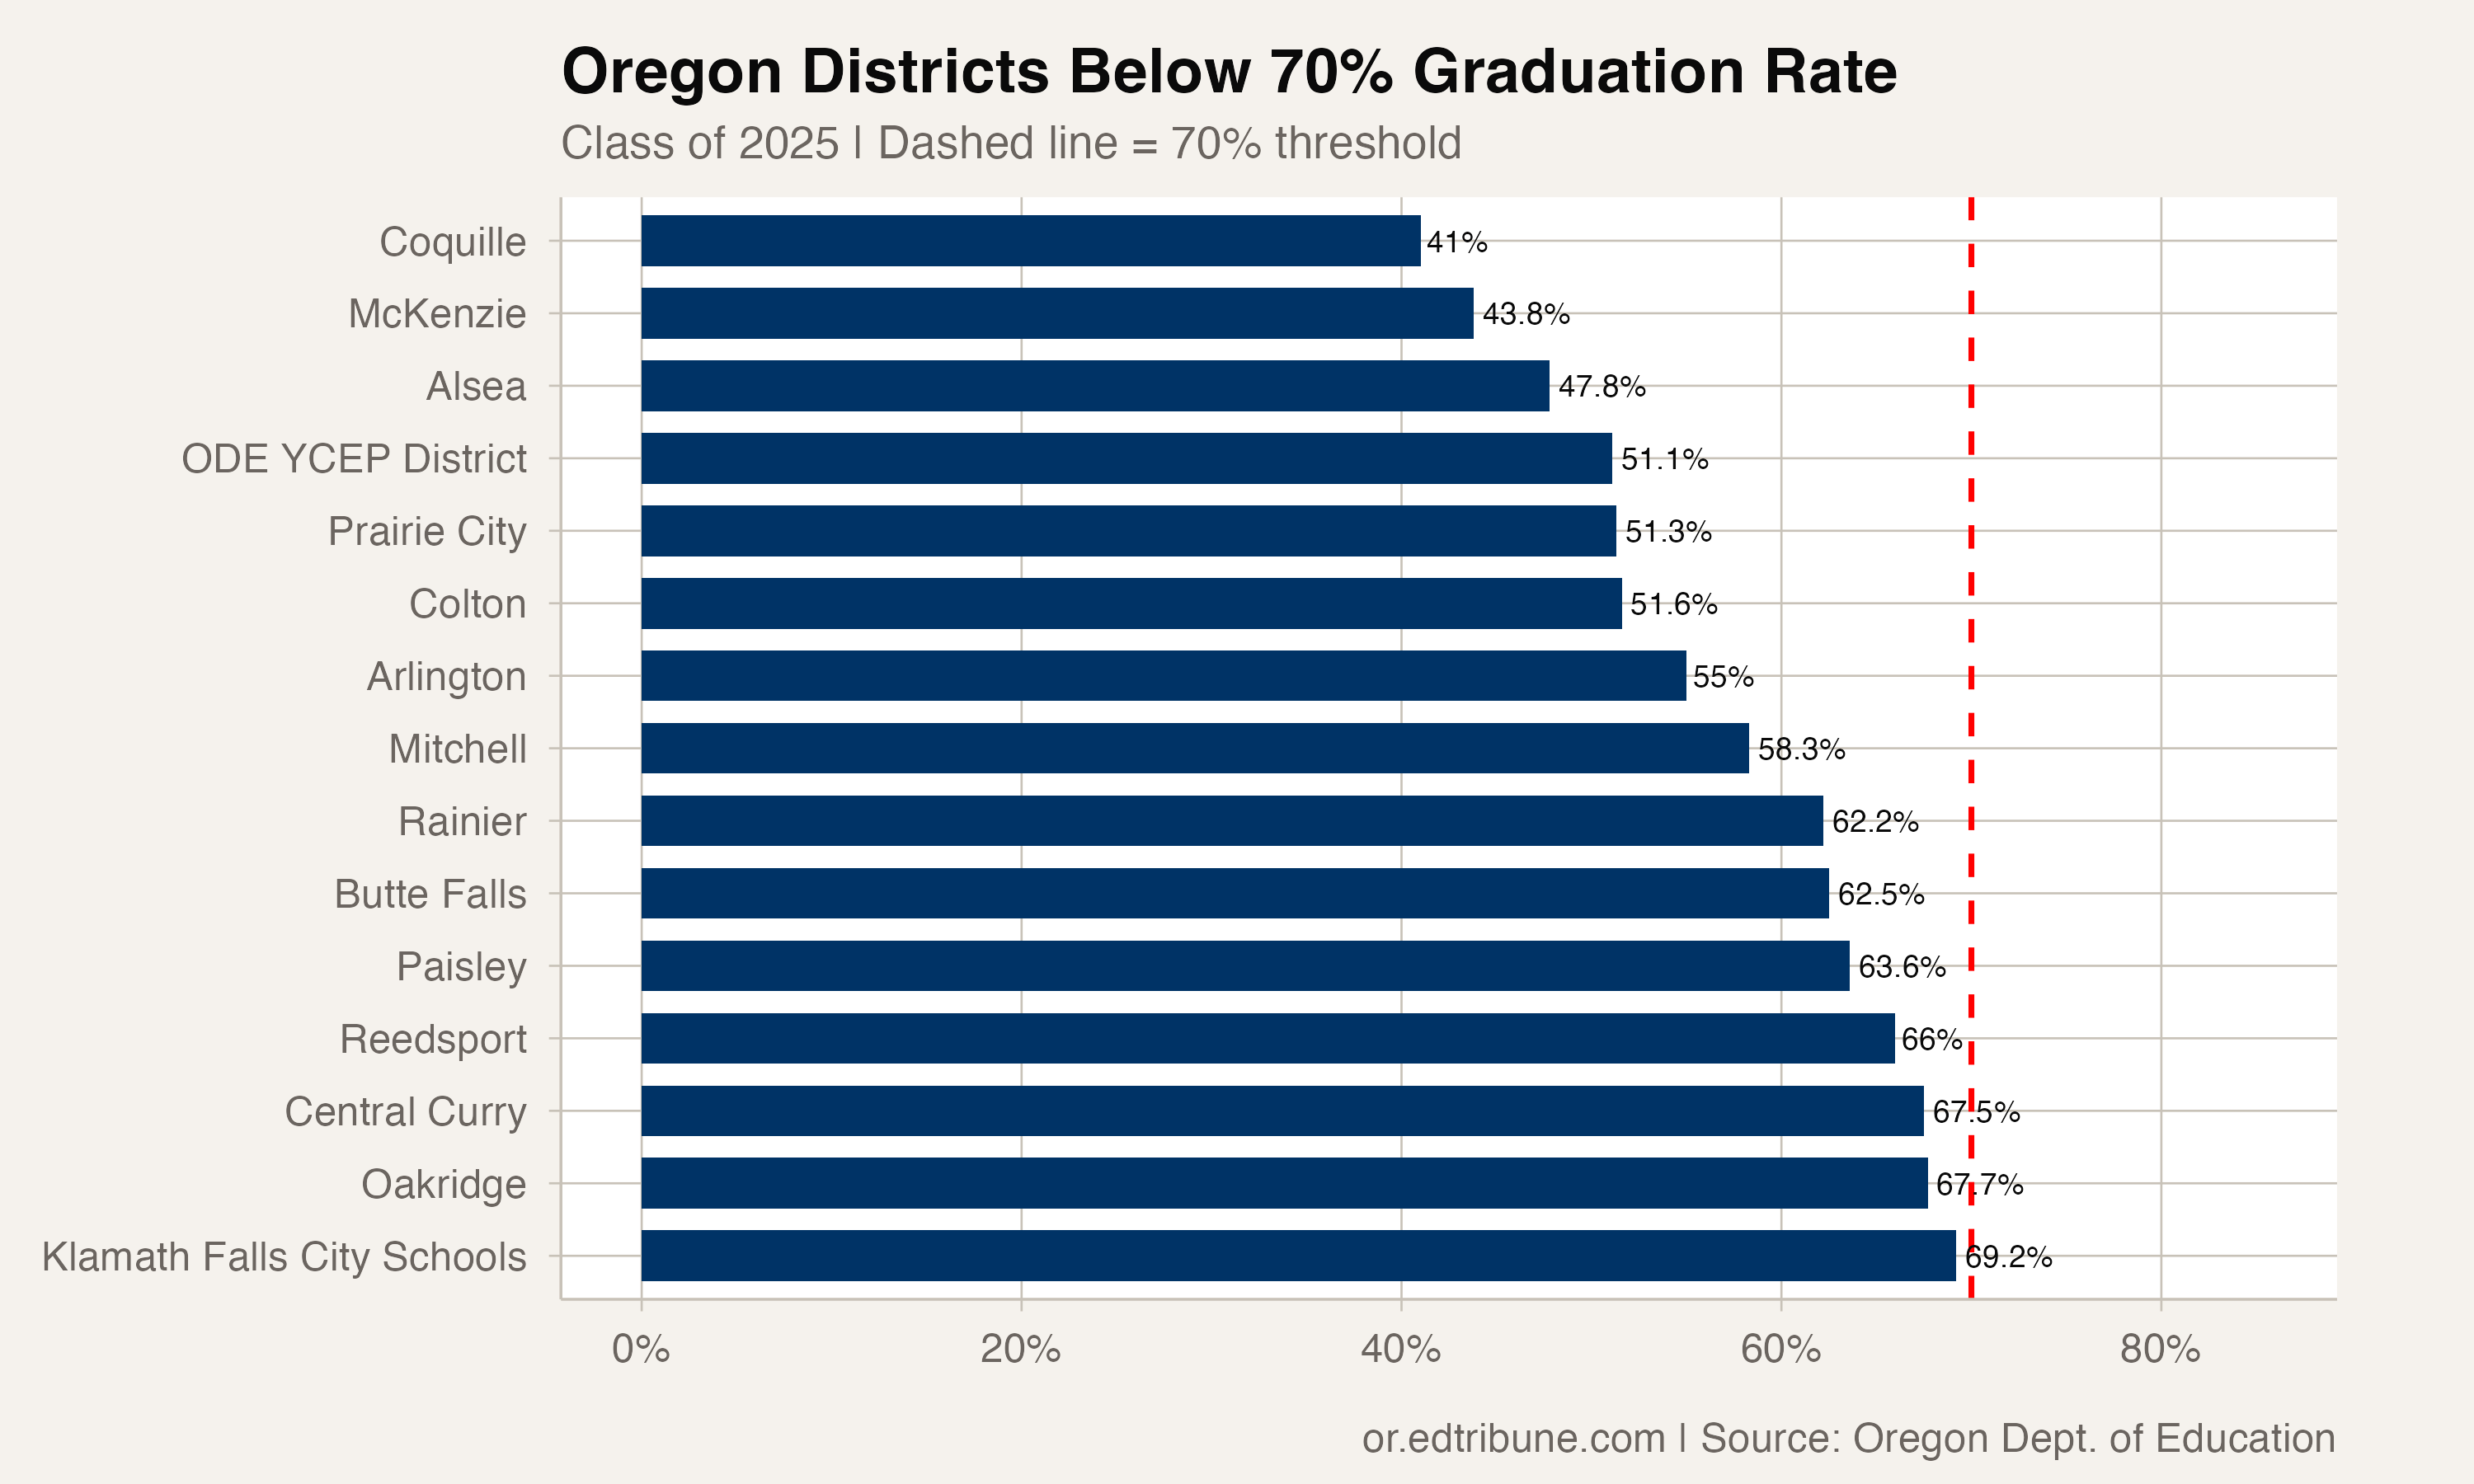
Scattered across rural and coastal Oregon, these 15 districts graduated fewer than 70% of their students in 2025. At the bottom sits Coquille↗ET at 41.0%, where fewer than half the 139 students in the graduating cohort earned a diploma on time. At the top of the crisis list, Klamath Falls City Schools↗ET graduated 69.2% of its 266 students, the largest district in the group.
The full list
The 15 districts below 70%, ranked from lowest to highest graduation rate for the Class of 2025:
| District | Graduation Rate | Cohort |
|---|---|---|
| Coquille SD 8 | 41.0% | 139 |
| McKenzie SD 68 | 43.8% | 16 |
| Alsea SD 7J | 47.8% | 23 |
| ODE YCEP District | 51.1% | 90 |
| Prairie City SD 4 | 51.3% | 226 |
| Colton SD 53 | 51.6% | 91 |
| Arlington SD 3 | 55.0% | 20 |
| Mitchell SD 55 | 58.3% | 187 |
| Rainier SD 13 | 62.2% | 74 |
| Butte Falls SD 91 | 62.5% | 16 |
| Paisley SD 11 | 63.6% | 11 |
| Reedsport SD 105 | 66.0% | 47 |
| Central Curry SD 1 | 67.5% | 40 |
| Oakridge SD 76 | 67.7% | 31 |
| Klamath Falls City Schools | 69.2% | 266 |
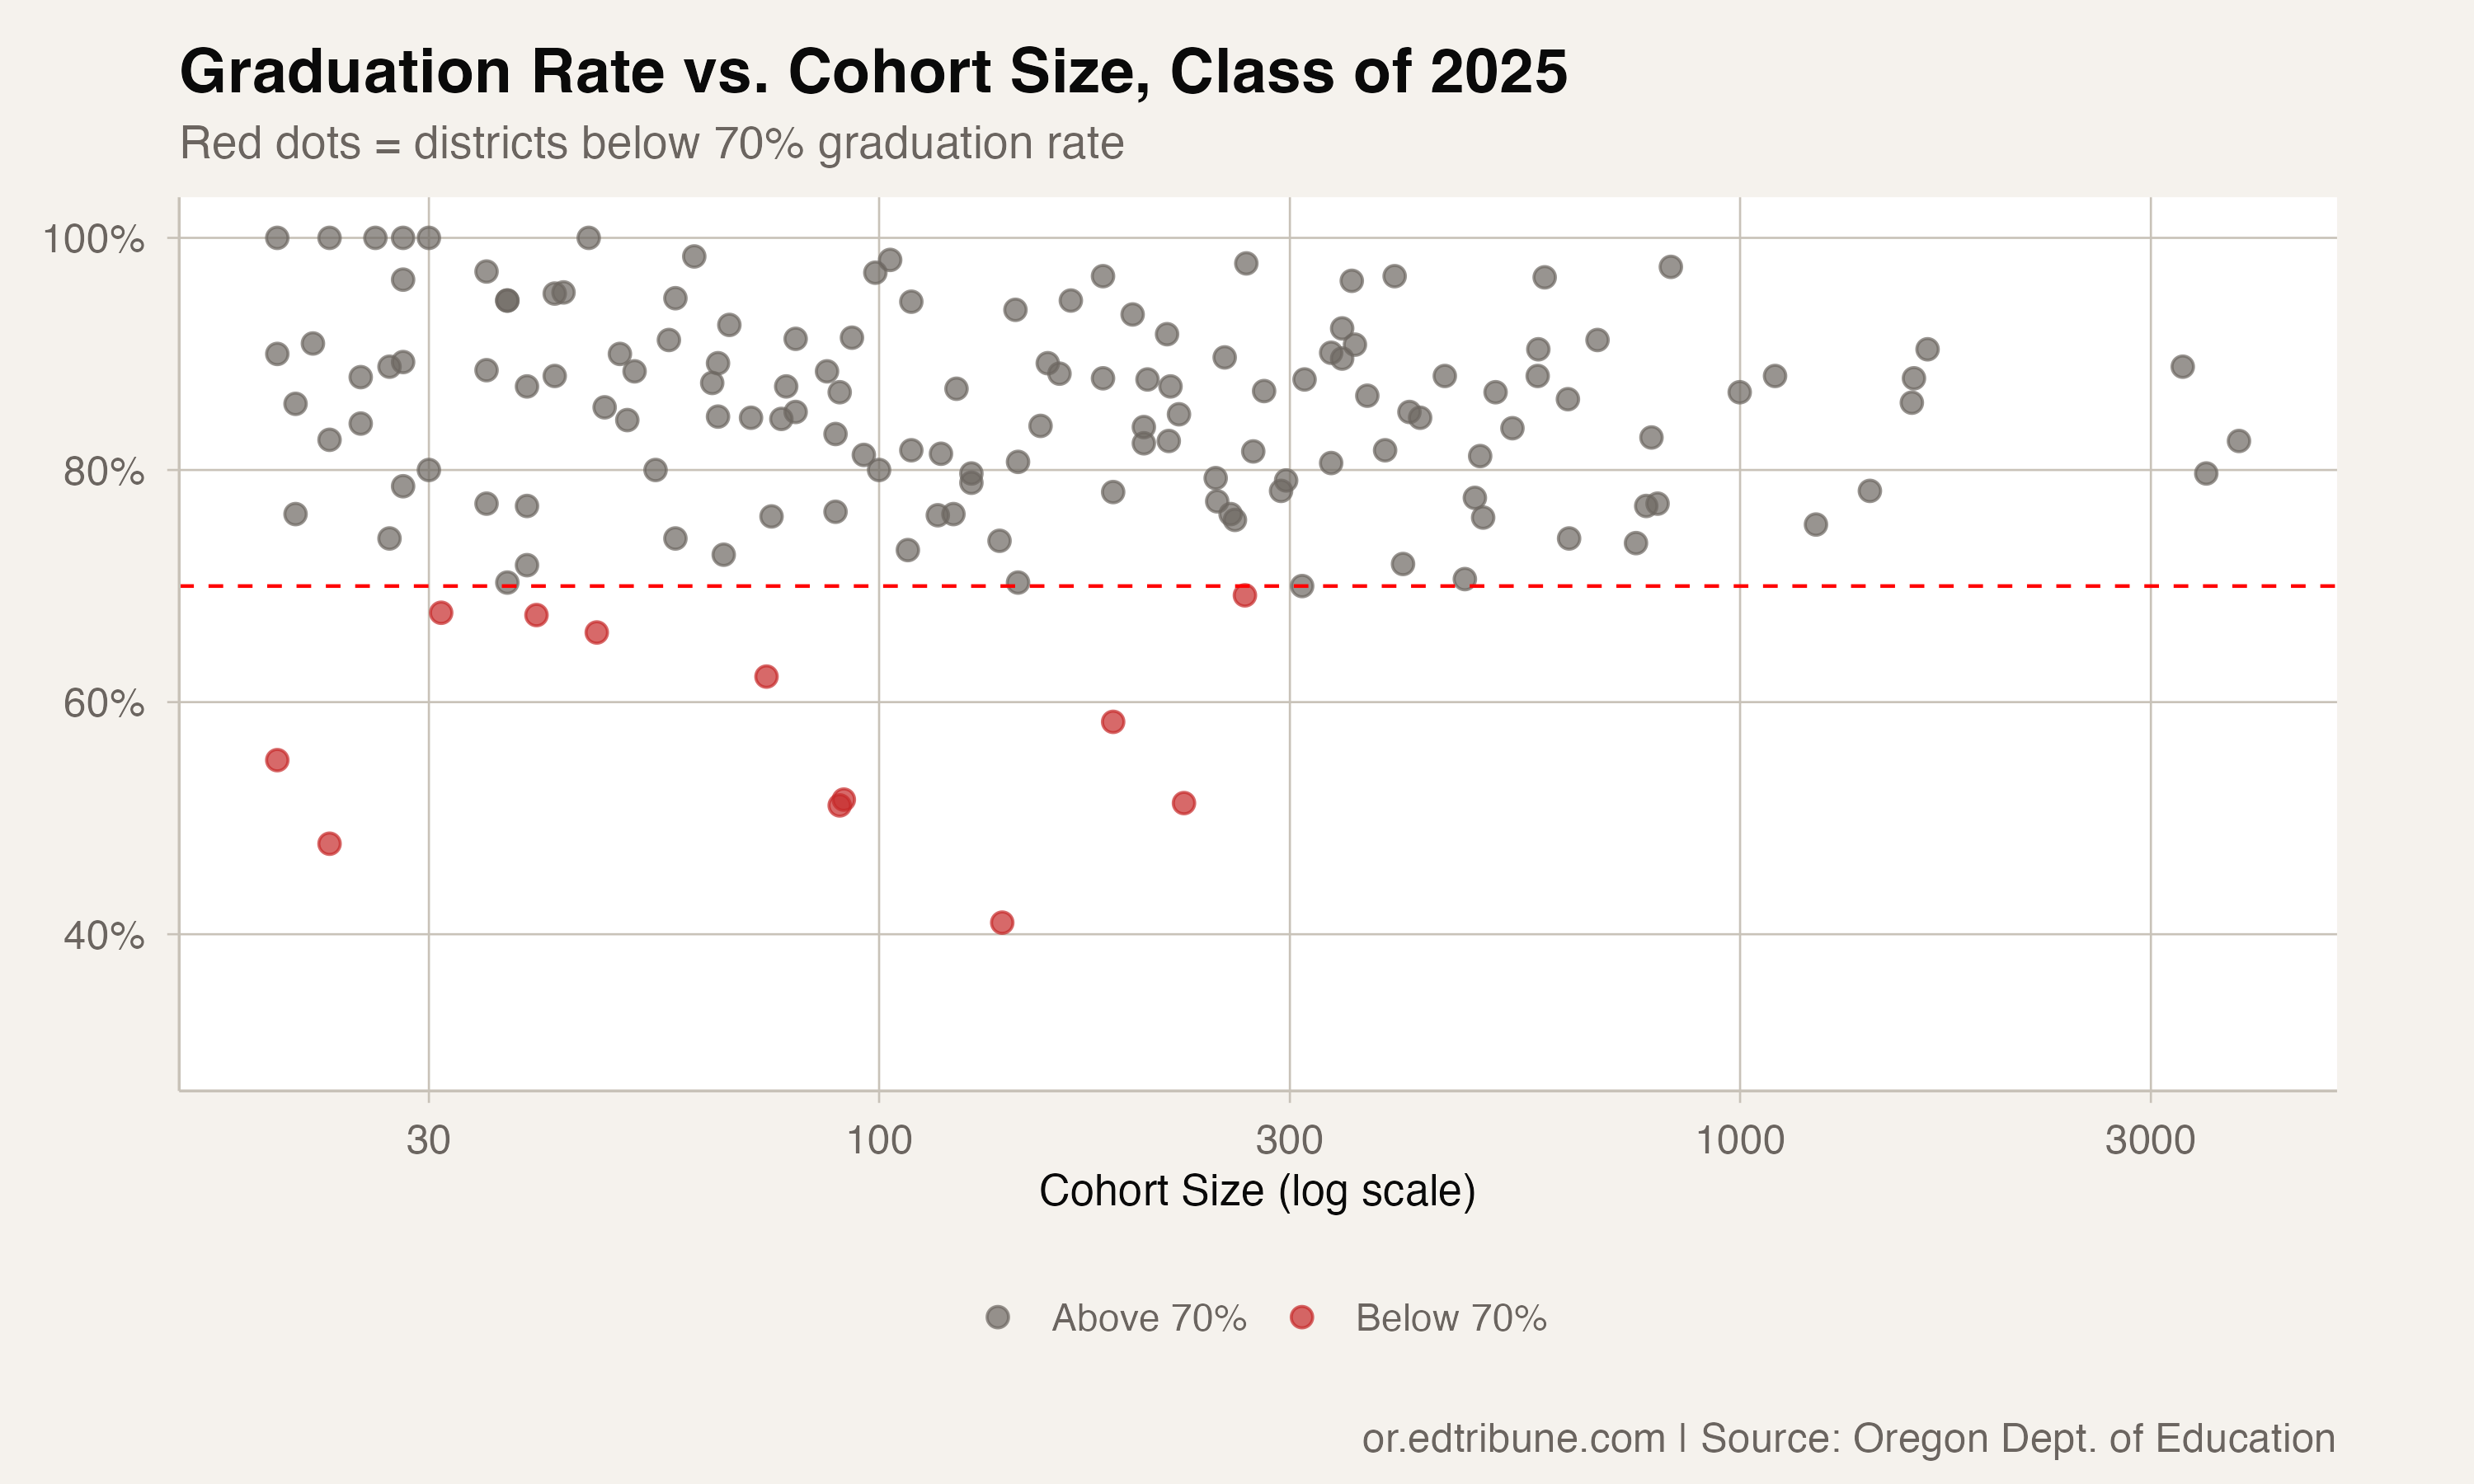
Several of these are small enough that a handful of students can swing the rate dramatically. McKenzie, Paisley, Butte Falls, and Arlington all have cohorts under 25. But others are not small. Prairie City (226 students), Mitchell (187), Coquille (139), and Colton↗ET (91) have cohorts large enough that statistical noise alone does not explain rates this far below the 70% line. Three of the four sit below 52%, with only Mitchell (58.3%) higher.
Where improvement failed to reach
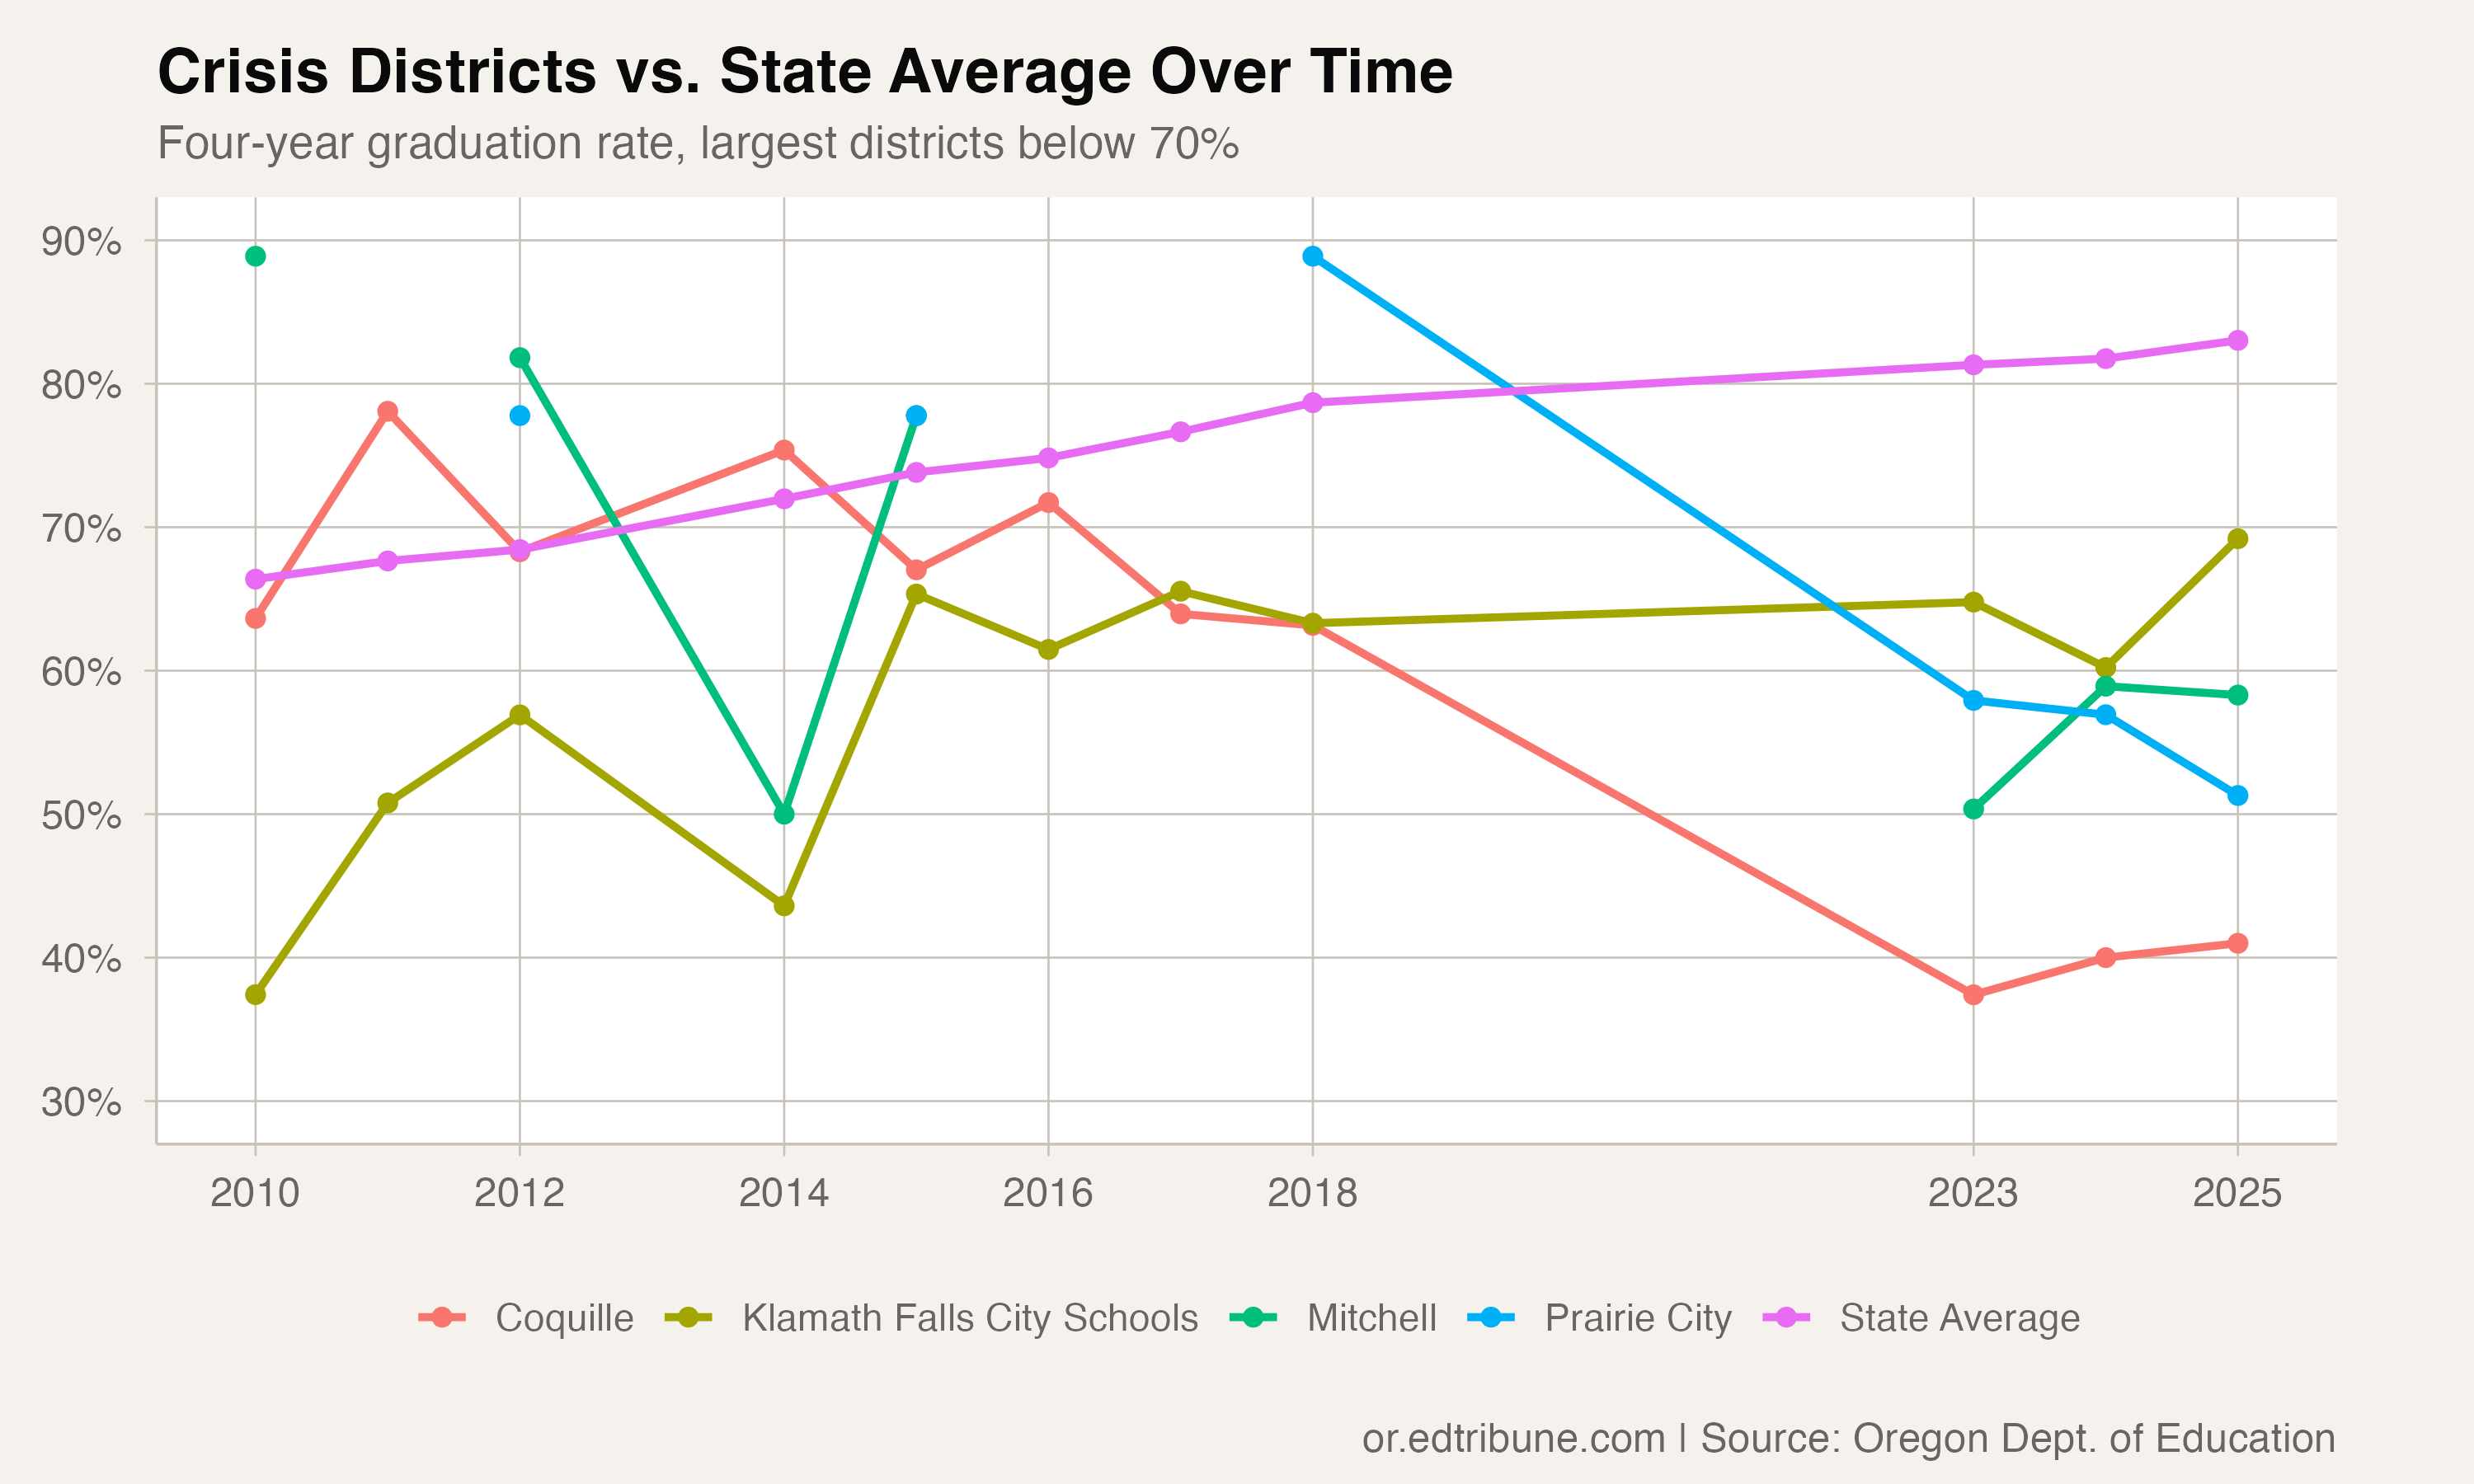
The state's long climb from 66.4% to 83.0% lifted most districts. The crisis list represents where that tide did not reach, or where it reached and then receded.
Some of these districts have been in trouble for years. Alsea, on the central Oregon coast, graduated 71.4% of its students in 2010 but has been below 50% for three of the last four data points. Rainier↗ET, north of Portland along the Columbia River, graduated 63.7% in 2010, peaked at 80.5% in 2018, but has since fallen back to 62.2% by 2025.
Others have volatile histories that reflect the statistical reality of small cohorts. Arlington went from 100% (2024, 12 students) to 55% (2025, 20 students). Butte Falls jumped from 90.5% (2010, 21 students) to the 50s and 60s in recent years.
A geographic pattern
The list clusters in places where Oregon's economy has contracted. Coquille, Reedsport, and Central Curry are along the southern Oregon coast, where the timber industry decline hollowed out communities decades ago. Prairie City and Mitchell sit in the remote eastern Oregon interior. Oakridge, once a logging town in the Cascade foothills, has struggled economically since the spotted owl restrictions of the 1990s.
Klamath Falls stands apart as the only true urban center on the list. With 266 students, its 69.2% rate suggests systemic challenges beyond the small-district volatility that explains much of the rest.
The ODE YCEP District, which serves students in the Youth Corrections Education Program, reflects a different population entirely. Its 51.1% rate for 90 students measures graduation among incarcerated youth, a population facing barriers that no school improvement strategy alone can address.
What the record high obscures
A statewide record can obscure how unevenly progress is distributed. Oregon at 83.0% is genuinely good news for most of the state's 48,563 graduating seniors. But for the roughly 550 students in these 15 districts who did not graduate on time, the state's record offers no comfort.
Coquille's 41% rate sits just 150 miles from Medford's 88%. The distance between them is not just geography. It is the difference between a district that found a way to climb and one that has not found a foothold.
Data source
Four-year adjusted cohort graduation rate data from the Oregon Department of Education. Data covers the Class of 2010 through the Class of 2025, excluding 2013 and 2019-2022. Oregon's essential skills testing requirement has been suspended through 2027-28. Some district/subgroup/year combinations contain duplicate rows in the source data; rates reported here use the mean of available values.
Detailed code that reproduces the analysis and figures in this article is available exclusively to EdTribune subscribers.
Discussion
Sign in to join the discussion.
Loading comments...