Correction: An earlier version of this article described Medford as Oregon's fifth-largest district by cohort size and its graduation improvement streak as the single longest in Oregon. Medford is the state's ninth-largest district by 2025 cohort, and Redmond shares the same improvement-streak length, so Medford's is among the longest rather than uniquely the longest. The article has been updated.
Southern Oregon does not usually make the short list when education reporters look for turnaround stories. Medford SD 549C↗ET, the region's largest district, would like to change that.
Medford's graduation rate has improved for eight consecutive reporting years, among the longest active improvement streaks in Oregon, climbing from 80.5% in 2018 to 88.1% in 2025. (Oregon did not publish comparable graduation data from 2019 through 2022, so the streak spans eight data points across 2014-2018 and 2023-2025, not eight calendar years.) The longer view is even more striking: 61.6% in 2010, meaning the district has gained 26.5 percentage points over fifteen years.
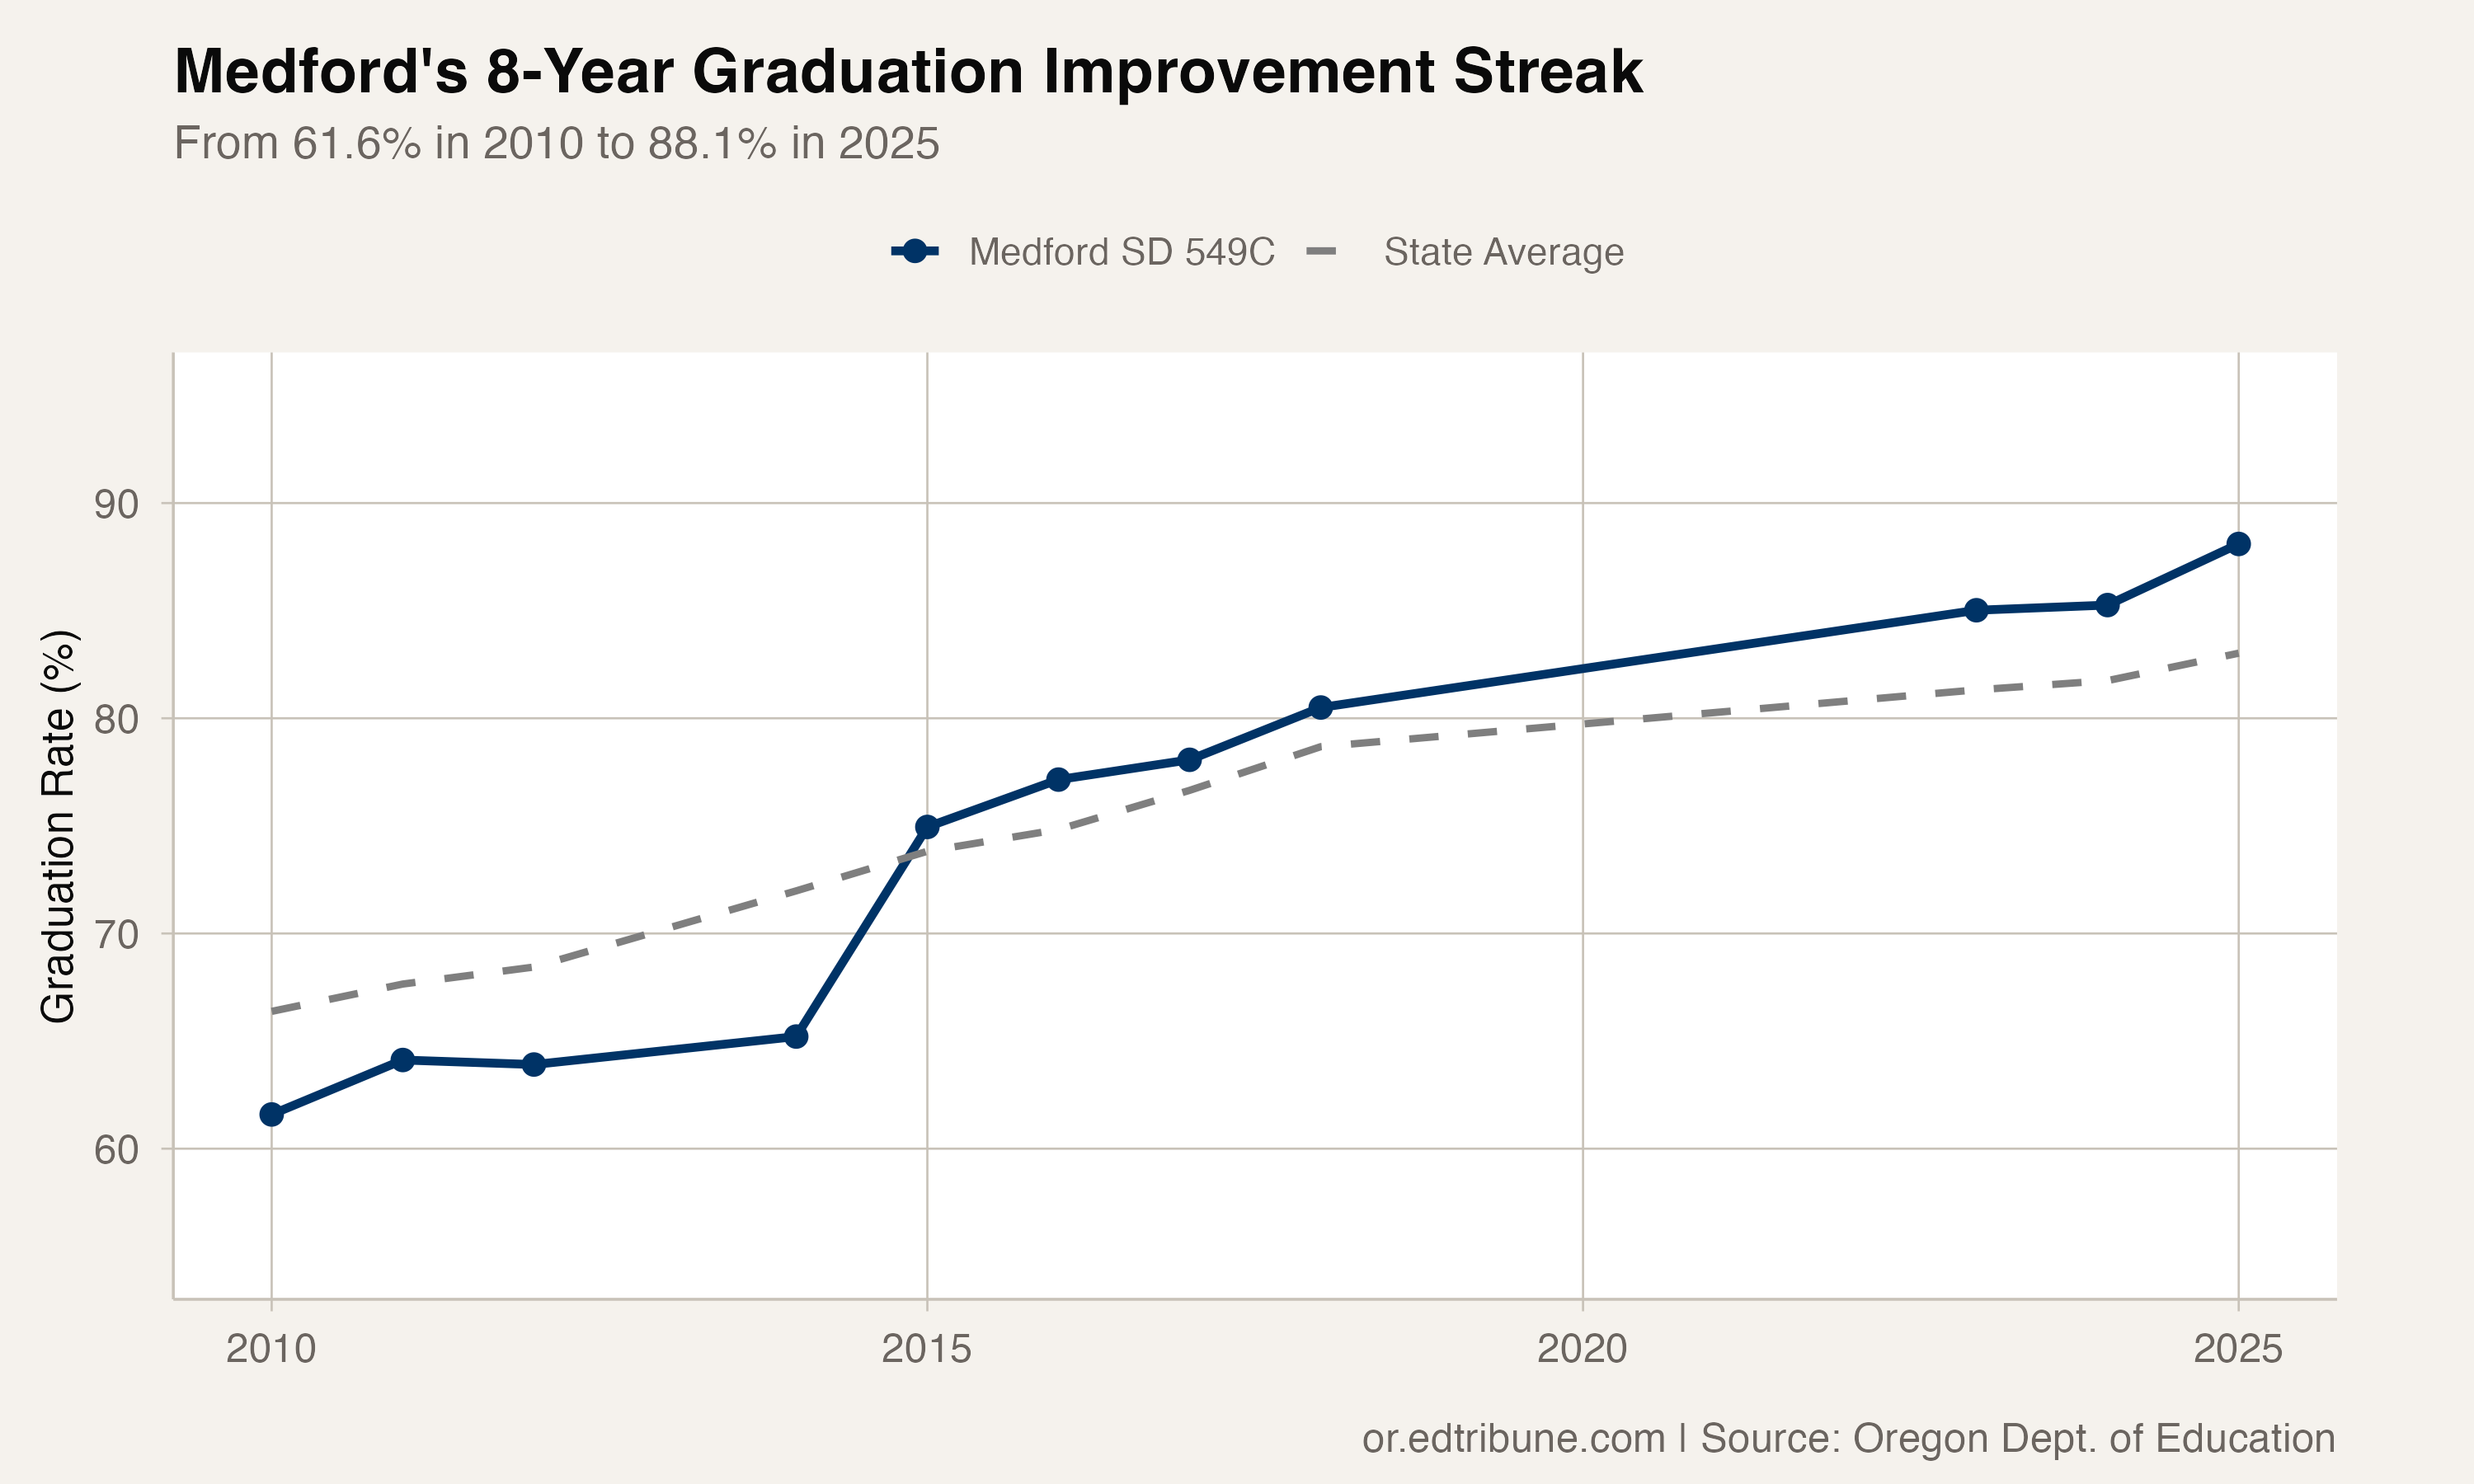
A District That Kept Climbing
With 1,098 graduates in the Class of 2025, Medford is Oregon's ninth-largest district by cohort size. The rate of improvement has been consistent enough to look institutional rather than accidental.
| Year | Medford | State Average | Difference |
|---|---|---|---|
| 2010 | 61.6% | 66.4% | -4.8 |
| 2014 | 65.2% | 72.0% | -6.8 |
| 2018 | 80.5% | 78.7% | +1.8 |
| 2023 | 85.0% | 81.3% | +3.7 |
| 2025 | 88.1% | 83.0% | +5.1 |
Medford crossed the state average around 2017 and has pulled further ahead in each subsequent year. The 5.1-point advantage in 2025 is the district's largest in the data.
The English Learner Jump
Perhaps the most eye-catching number in Medford's recent data is its English learner graduation rate: 77.5% in 2025, up from 62.2% in 2023. Before that, rates hovered in the 50s for most of the decade. The 2024 rate was even higher at 80.2%.
Medford's LEP cohort of 71 students is small enough that individual interventions can move the needle. But a jump from the mid-50s to the high-70s suggests something more systematic than luck.
Across Subgroups
Medford's 2025 profile shows strength across categories:
| Subgroup | Graduation Rate | Cohort |
|---|---|---|
| All Students | 88.1% | 1,098 |
| White | 89.0% | 665 |
| Hispanic | 85.7% | 335 |
| Econ. Disadvantaged | 80.1% | 497 |
| Special Ed | 78.2% | 170 |
| English Learners | 77.5% | 71 |
The white-Hispanic gap in Medford is just 3.3 points, narrower than the statewide gap. Special education students at 78.2% are 6 points above the statewide special education rate. Even the economically disadvantaged rate of 80.1% is 9 points above the statewide figure for that group.
What Medford Did
The district has credited several strategies for its sustained improvement: quarterly credit-acquisition analysis to identify students falling behind, early intervention systems that flag freshmen who are off-track, an expanded Freshman Academy program, and attendance improvement initiatives.
None of these are exotic innovations. They are the blocking-and-tackling of dropout prevention: track students, intervene early, keep them engaged. What distinguishes Medford is the consistency of execution over eight consecutive reporting years.
The Southern Oregon Context
Medford sits in the Rogue Valley, where economic conditions have shifted from timber dependence toward healthcare, retail, and agriculture. The district's growing Hispanic student population (335 graduates in 2025, about 30% of the cohort) reflects the region's diversification.
At 88.1%, Medford now graduates at a higher rate than Portland (82.5%), Eugene (not in the all-time high list), and most of the state's largest districts. For a district that was 5 points below average a decade ago, that is a reversal worth studying.
Data Source
This analysis uses four-year adjusted cohort graduation rate data published by the Oregon Department of Education, covering the Classes of 2010 through 2025 (excluding 2013 and 2019-2022, years when comparable data was not published).
Detailed code that reproduces the analysis and figures in this article is available exclusively to EdTribune subscribers.
Discussion
Sign in to join the discussion.
Loading comments...