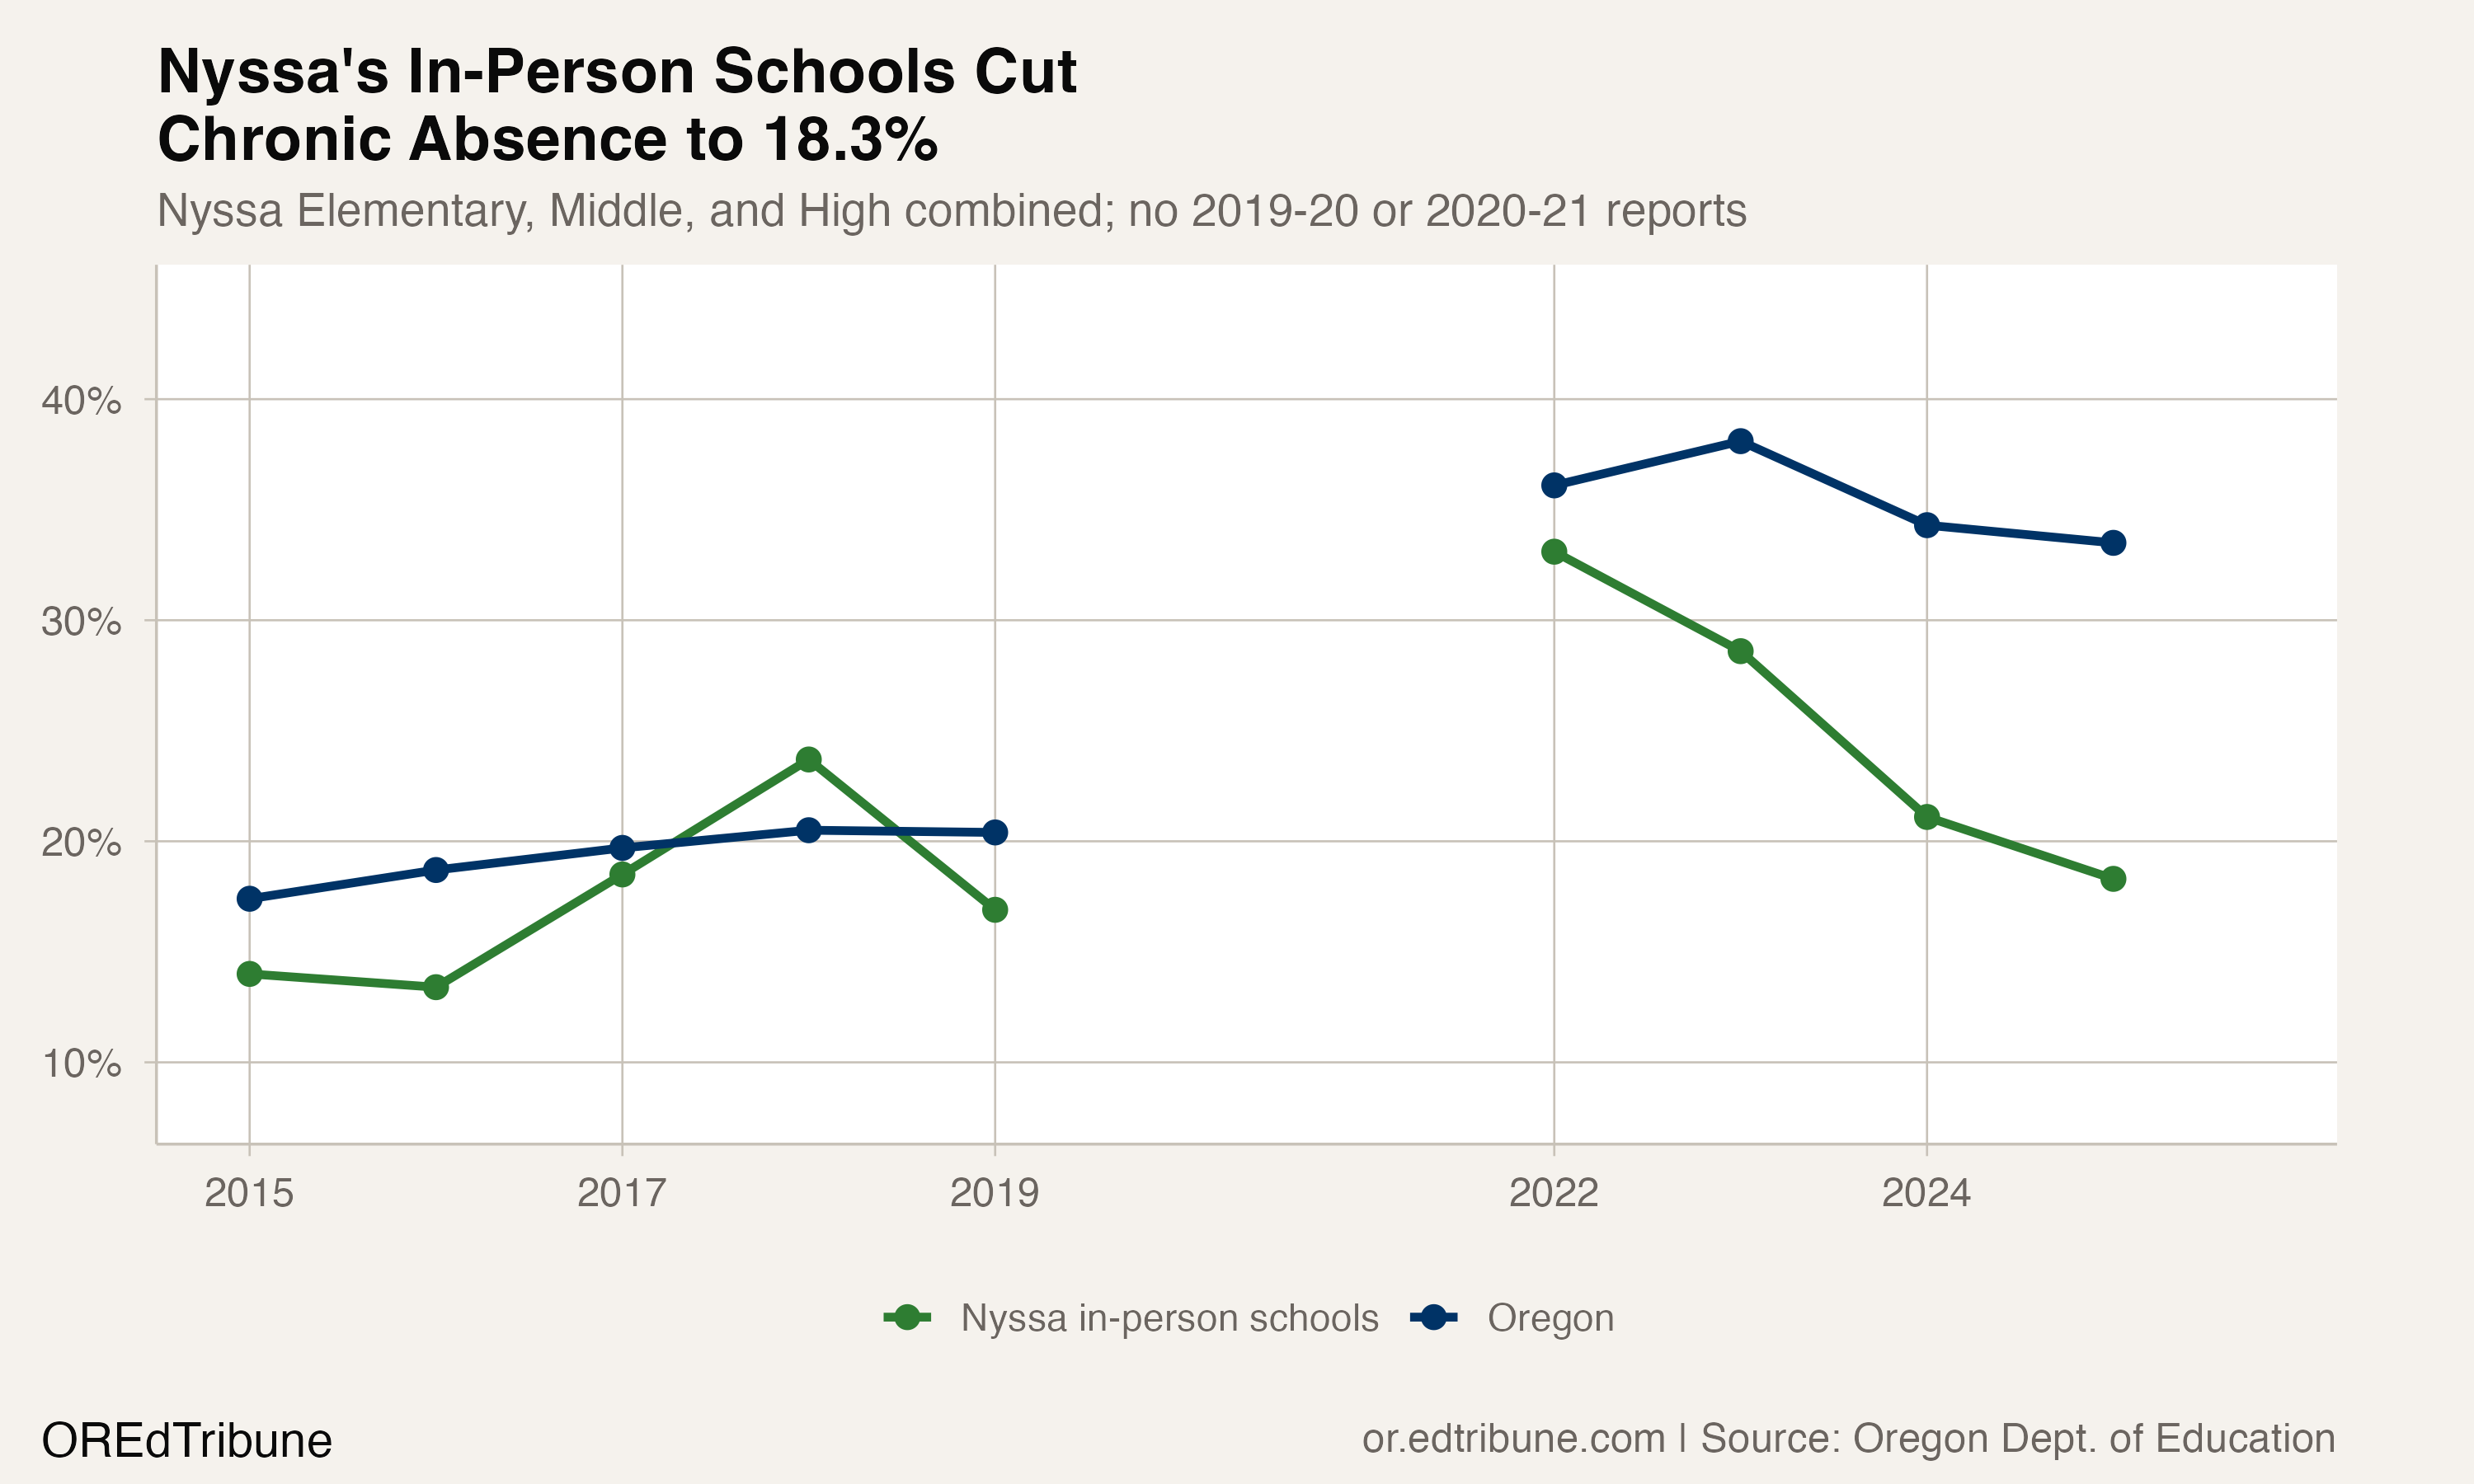
The three schools Nyssa School District↗ET has run throughout the past decade reported a combined 18.3% chronic absenteeism rate in 2024-25, down from 33.1% in 2021-22.
The rate fell in each of the three years between those endpoints, to 28.6% and then 21.1% before reaching 18.3%. Across Nyssa Elementary School, Nyssa Middle School, and Nyssa High School, the number of students reported chronically absent dropped from 378 to 199, out of 1,090 students measured in 2024-25.
A steeper decline than the state recorded
Oregon's statewide chronic absenteeism rate was 36.1% in 2021-22 and 33.5% in 2024-25, a decline of 2.6 points. Nyssa's three in-person schools fell 14.8 points over the same period.
The two figures rest on different bases. Oregon's number covers every student the state measures, including those enrolled in virtual programs. The Nyssa number covers the district's three physical schools and nothing else.
Nyssa's schools have also not returned to the last year measured before the pandemic. Their combined rate in 2018-19 was 16.9%, which leaves the 2024-25 result 1.4 points higher. One year is a thin benchmark at this grain, though. Across the five pre-pandemic years in this analysis the three schools ranged from 13.4% in 2015-16 to 23.7% in 2017-18, so 2024-25 sits inside the band Nyssa recorded before 2020 rather than above all of it.
Superintendent Ryan Hawkins cautioned against reading across the gap without care. "There have been changes in definitions, reporting, and the way attendance data are discussed, so comparing historical percentages without accounting for those differences may not always provide an apples-to-apples comparison," he wrote in response to questions from The OREdTribune. Oregon's own statewide rate moved from 20.4% in 2018-19 to 36.1% in 2021-22, and the state reported no chronic-absence figures for the two years between them.
Every school improved
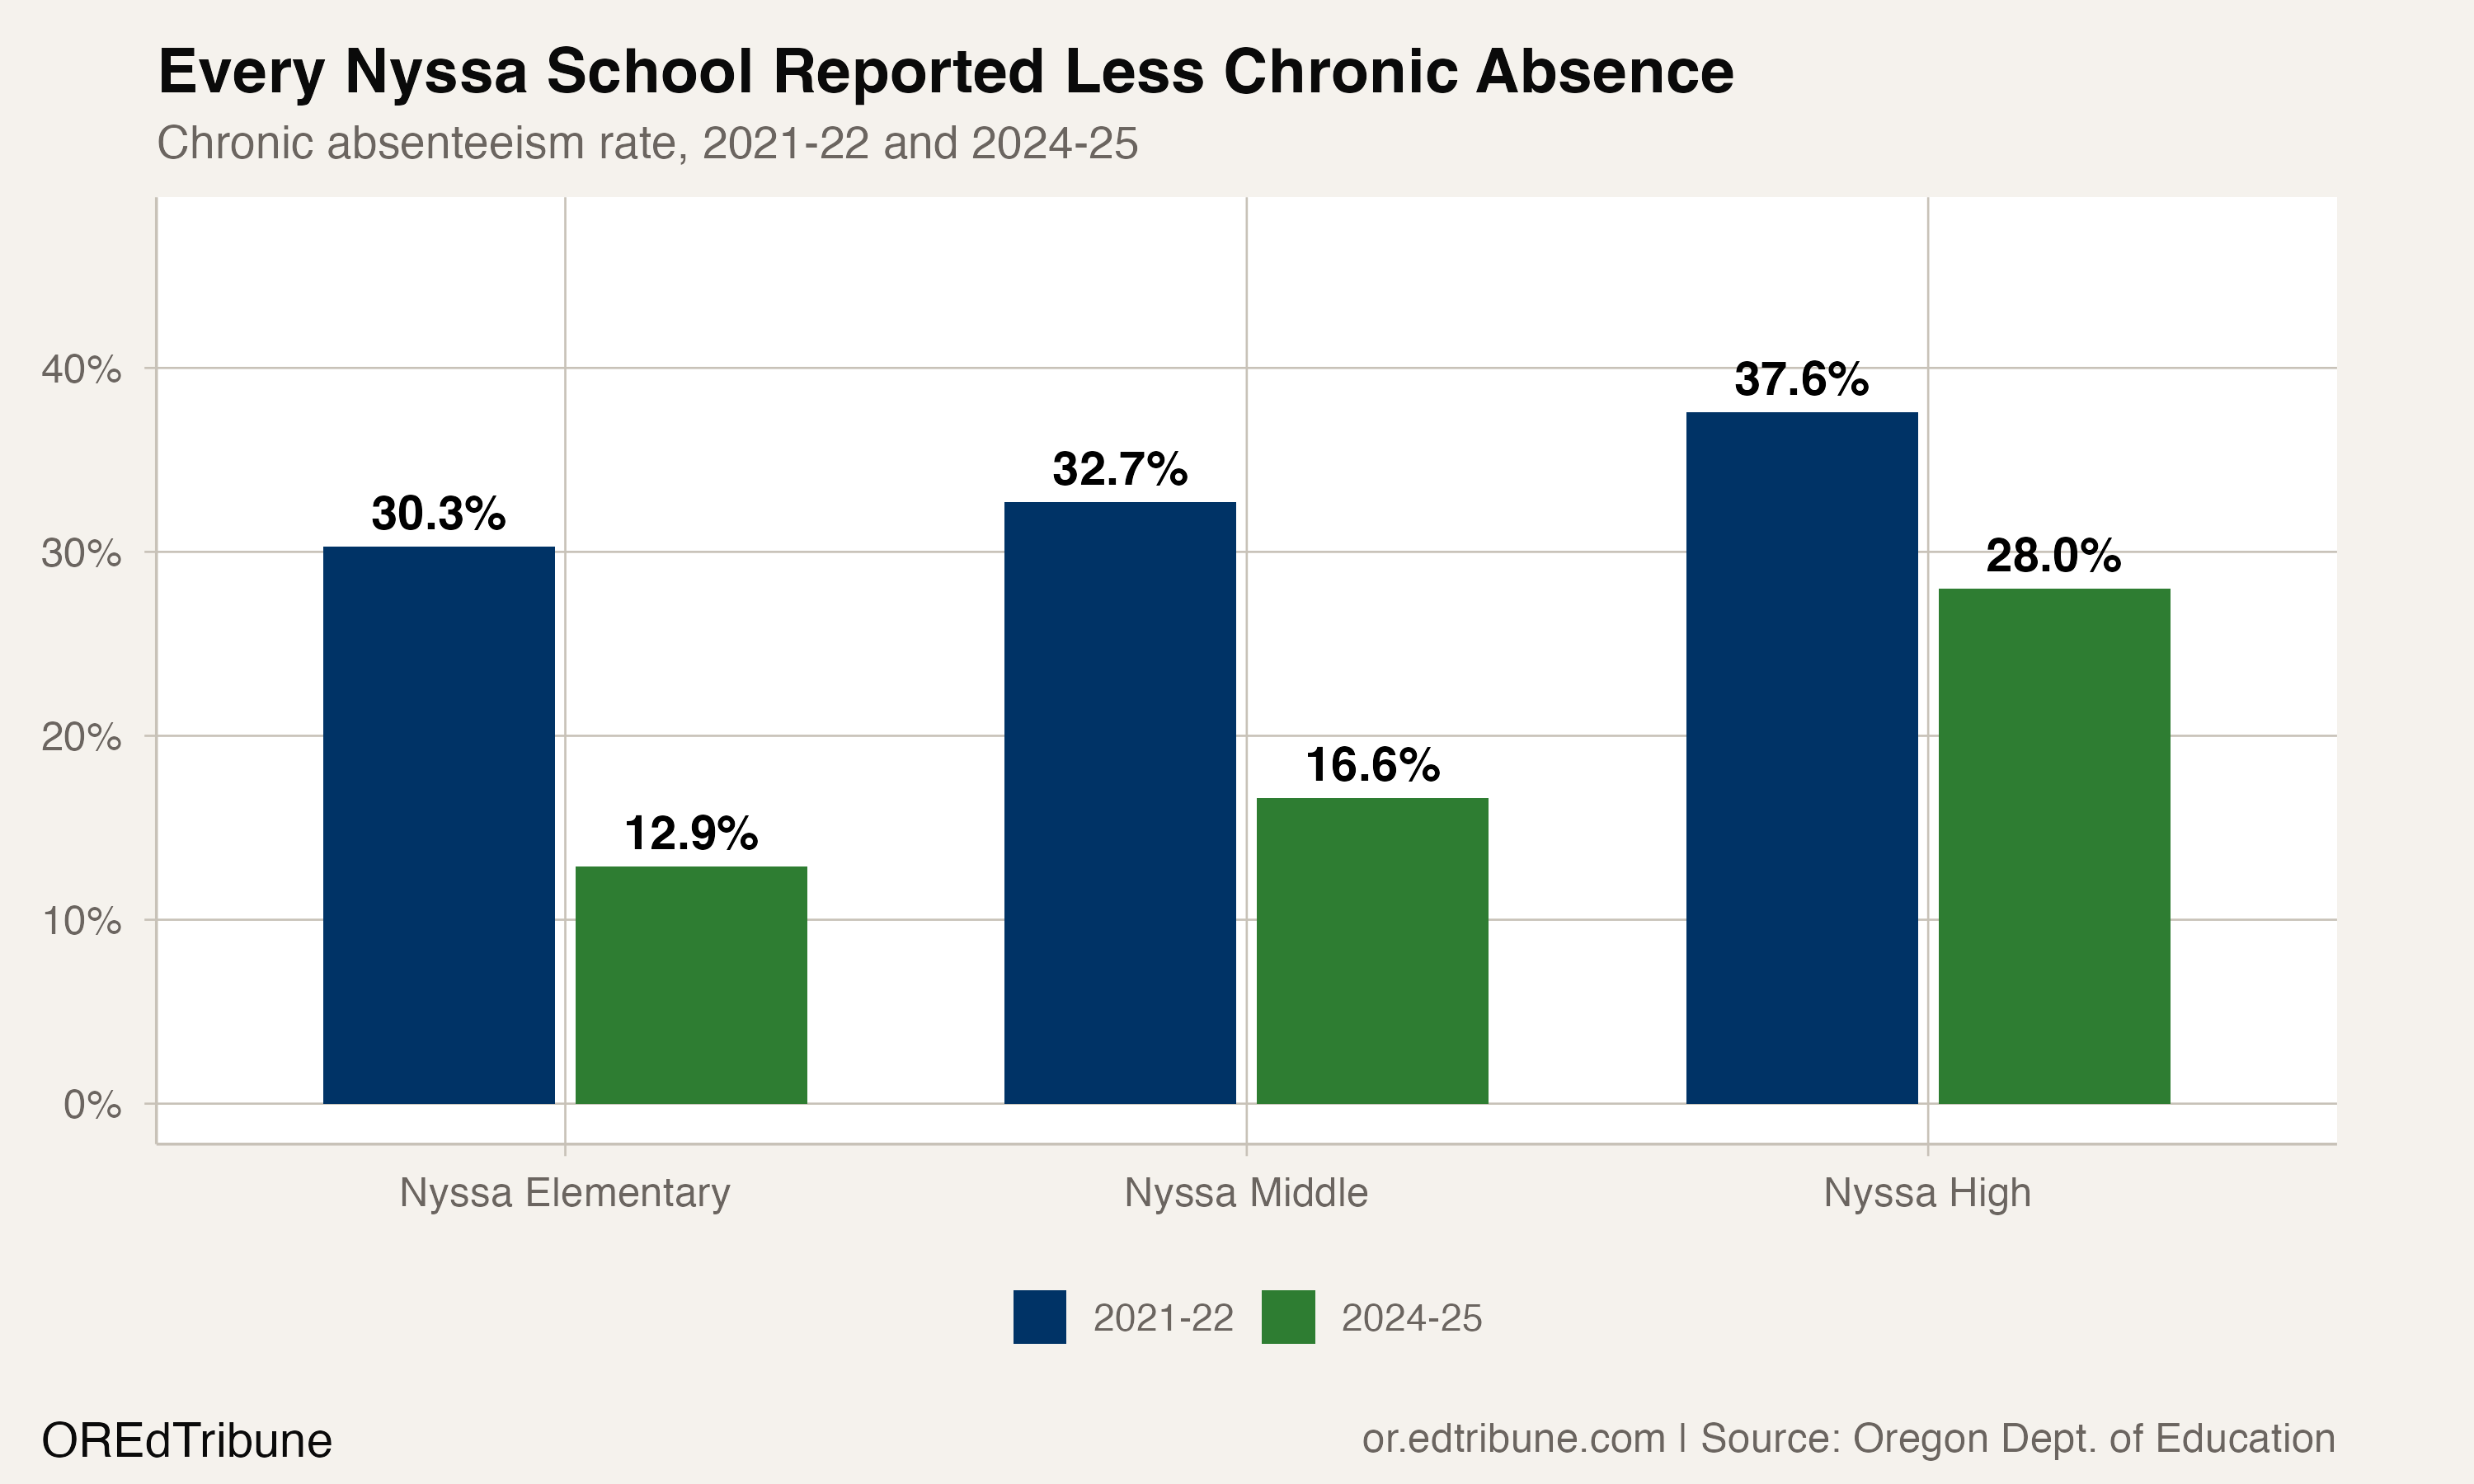
Nyssa Elementary School fell from 30.3% to 12.9%. Nyssa Middle School fell from 32.7% to 16.6%. Nyssa High School fell from 37.6% to 28.0%, the smallest of the three declines and the highest remaining rate.
Why this article does not use the district-wide rate
Nyssa opened Nyssa Virtual School in 2022-23. It enrolled 145 students in its first year and 987 in 2024-25, or 46.6% of the district's 2,117 students. The Oregon Department of Education publishes no chronic absenteeism figures for that school: its rows in the attendance file carry no student count and no chronically absent count in any of the three years it has operated.
Those students still sit inside the district-level row. The number of students measured for chronic absence in Nyssa's district row grew from 1,143 in 2021-22 to 2,185 in 2024-25, an increase of 91.2%, and the district row reports a 10.6% rate for 2024-25. In 2021-22, before the virtual school existed, that district row was exactly the sum of the three in-person schools. It is not now, and the size of the gap cannot be checked against the virtual school's own attendance figures, because the state does not publish them.
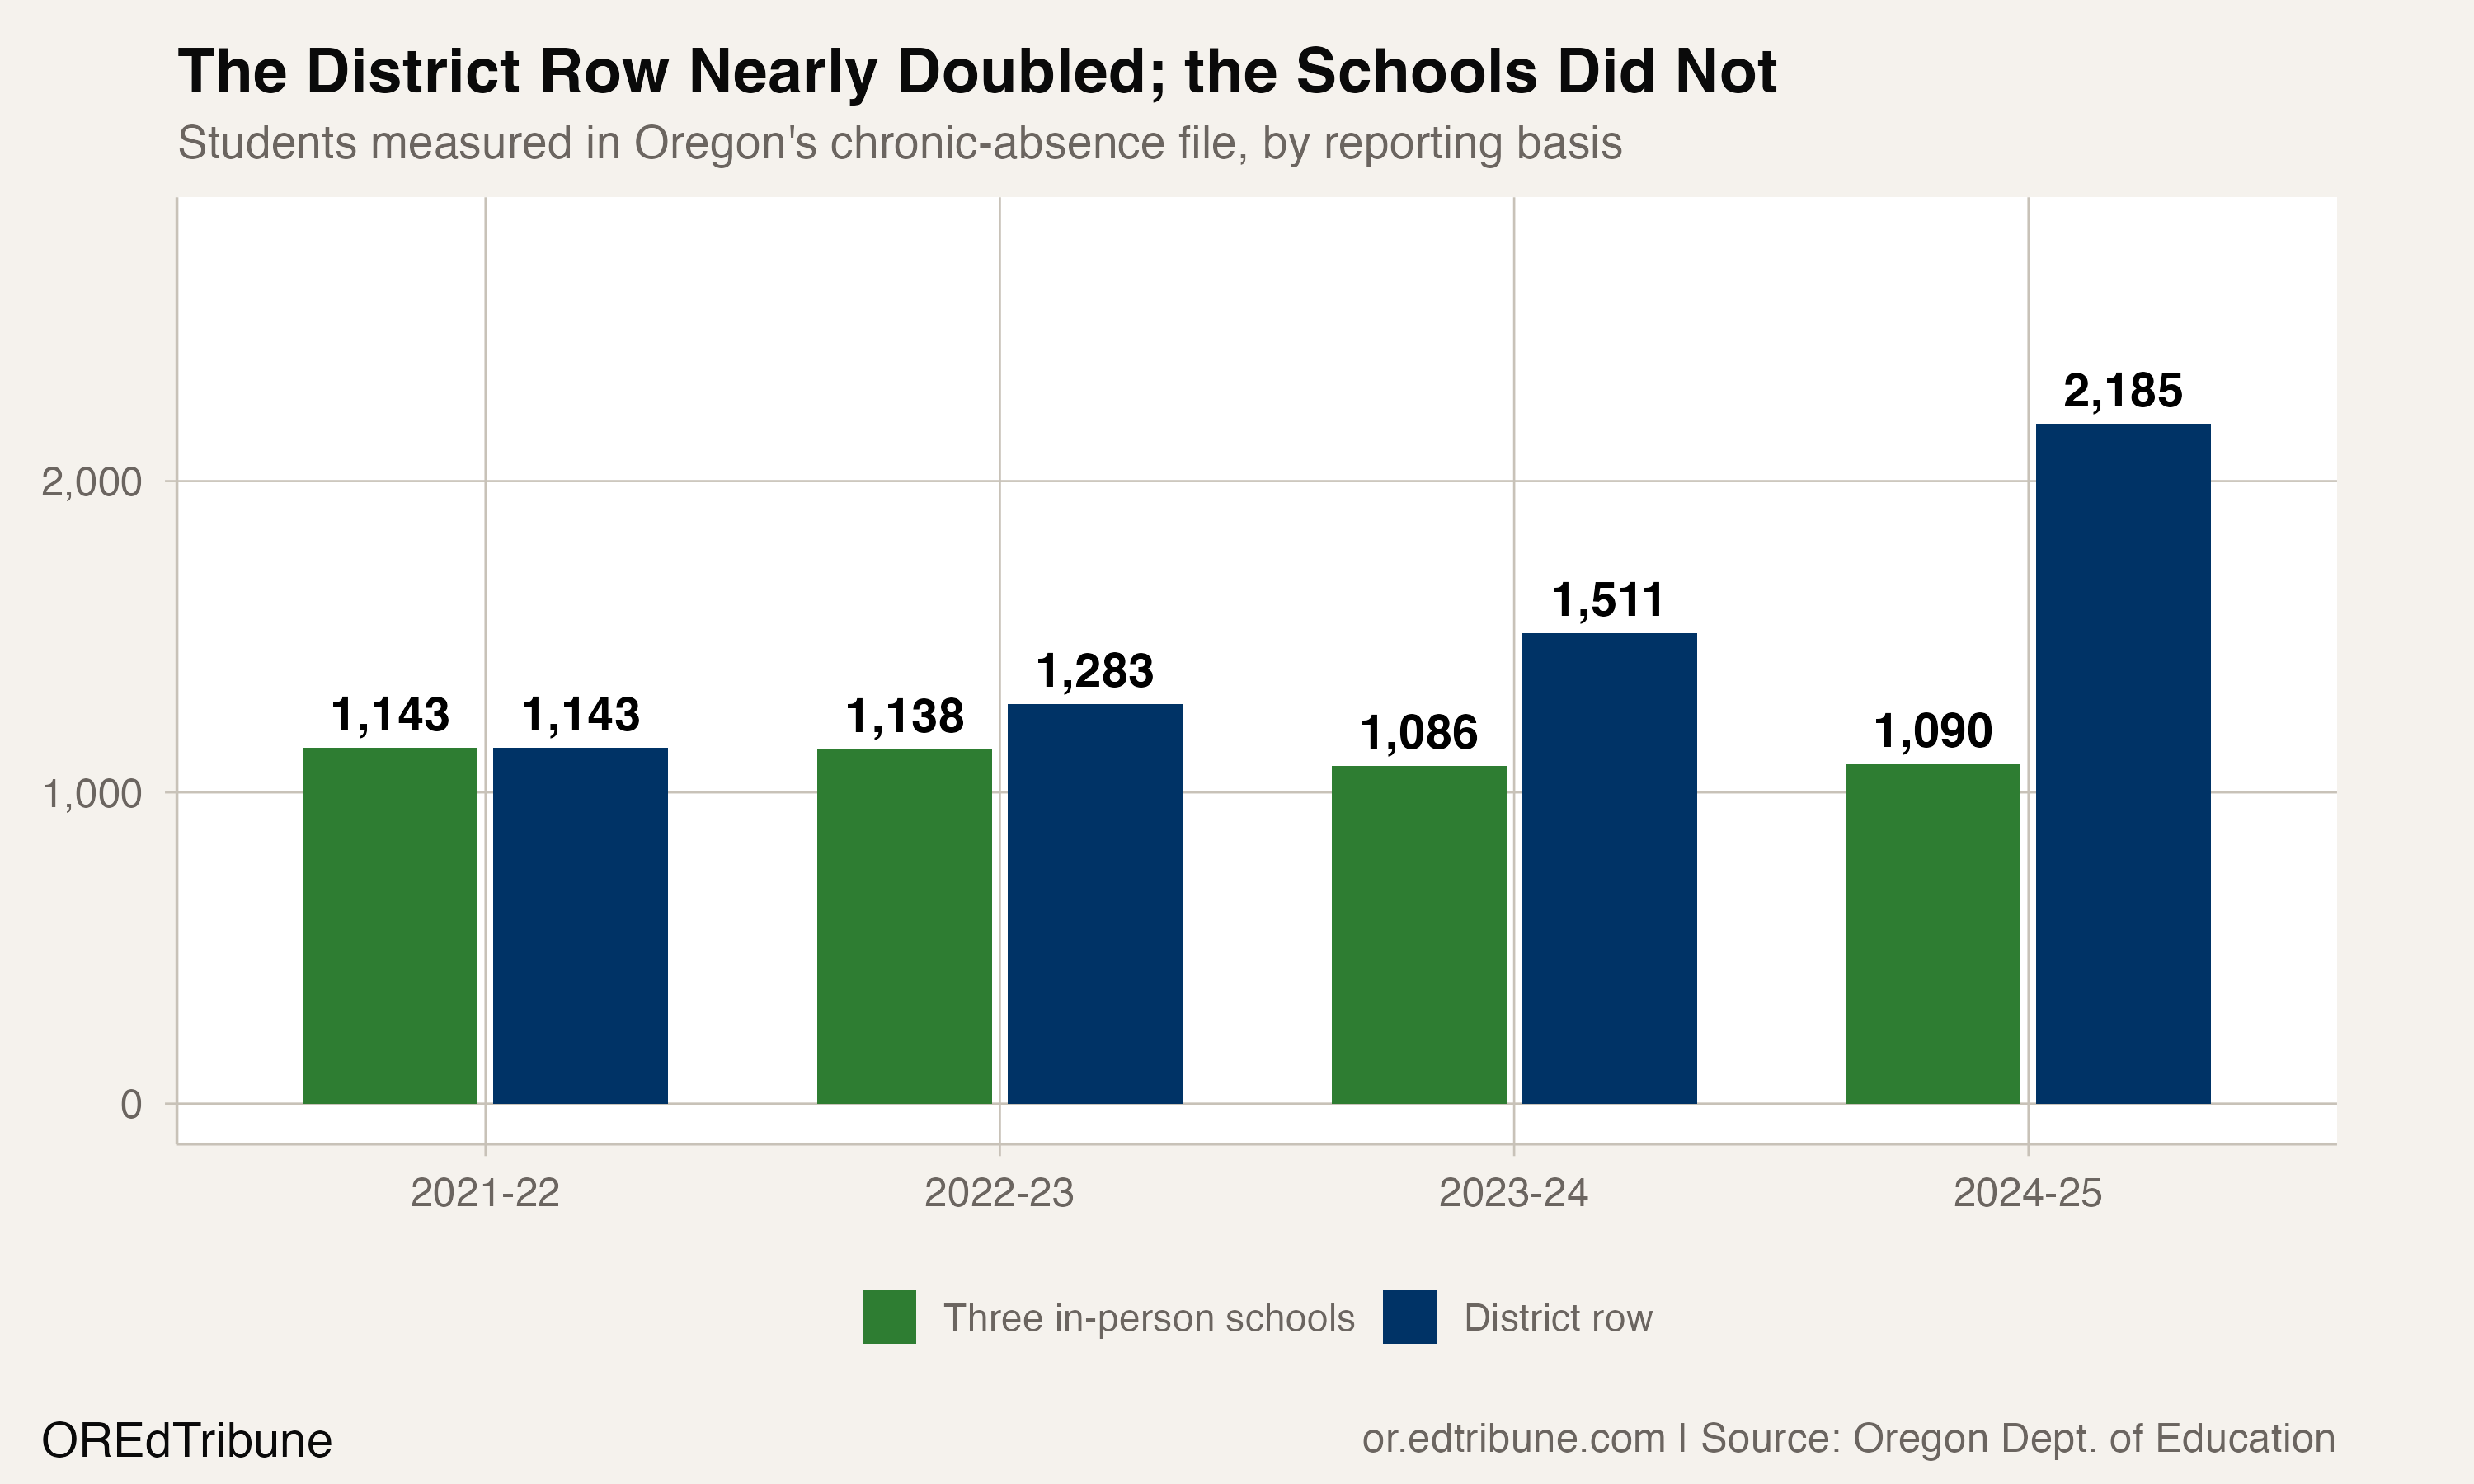
A rate that falls while its denominator nearly doubles is not measuring the same students at both ends. This article therefore reports the three schools Nyssa has run throughout, on one basis at both endpoints, and makes no statewide rank or enrollment-band comparison, because other Oregon districts' rows carry the same kind of unmeasured virtual population.
RELATED: Oregon's virtual charter growth is distorting rural district dataET
What the district changed
Hawkins said the district rebuilt its attendance work around a single premise. "When we revamped our attendance initiatives, we centered our approach around one foundational belief: attendance is about relationships," he wrote. "We know that simply telling students and families that they need to attend school is not enough. We have worked to build systems that increase communication, identify barriers, and provide support before attendance becomes a larger problem."
Families now hear about attendance more often, and students at risk of becoming chronically absent move through several levels of meetings. "The purpose of these meetings is not simply to address the number of absences, but to understand why a student is missing school and determine what support may help," Hawkins wrote.
Above the school-level meetings sits a District Attendance Team drawn from across the district, and Hawkins runs it himself. "I personally facilitate these meetings and meet with every family referred to the district-level team," he wrote. "I believe that is important because improving attendance has to be a priority from the top of the organization to the classroom." The team's job, as he described it, is to "understand what is contributing to the attendance issue, problem-solve barriers, connect families with available resources, and develop a plan for improvement."
Malheur County keeps an enforcement route behind that support. Families whose attendance remains a concern after interventions may be referred to attendance court and can face a fine, but Hawkins said "the goal remains improved attendance rather than punishment, and fines are often waived when attendance improves."
He counted the schools' climate work as part of the same effort, noting that "Nyssa Elementary was recently recognized as a national CharacterStrong Impact School, which is one example of the broader work taking place to help students feel connected to their schools."
What the numbers settle, and what they do not
The attendance files establish the rate decline across the three in-person schools, the reported counts behind it, and the composition change in the district row. They do not measure which of these changes produced the decline, and they cannot rank one against another. Hawkins's account is the district's own description of its work, offered in writing before publication.
One distinction he drew is worth carrying into any reading of the figures above. "It is important to distinguish the overall attendance rate from the chronic absenteeism rate, as they measure two different things," he wrote. "A district can have a relatively high overall attendance rate while still having a significant percentage of individual students who meet the definition of chronically absent." Every rate in this article is chronic absenteeism, the share of students the state flags as chronically absent, not the share of school days attended.
Rates and counts come from the Oregon Department of Education's Public Transparency attendance reports and its enrollment reports. The analysis uses the available years from 2014-15 through 2018-19 and 2021-22 through 2024-25 without filling the reporting gap.
Detailed code that reproduces the analysis and figures in this article is available exclusively to EdTribune subscribers.
Discussion
Sign in to join the discussion.
Loading comments...