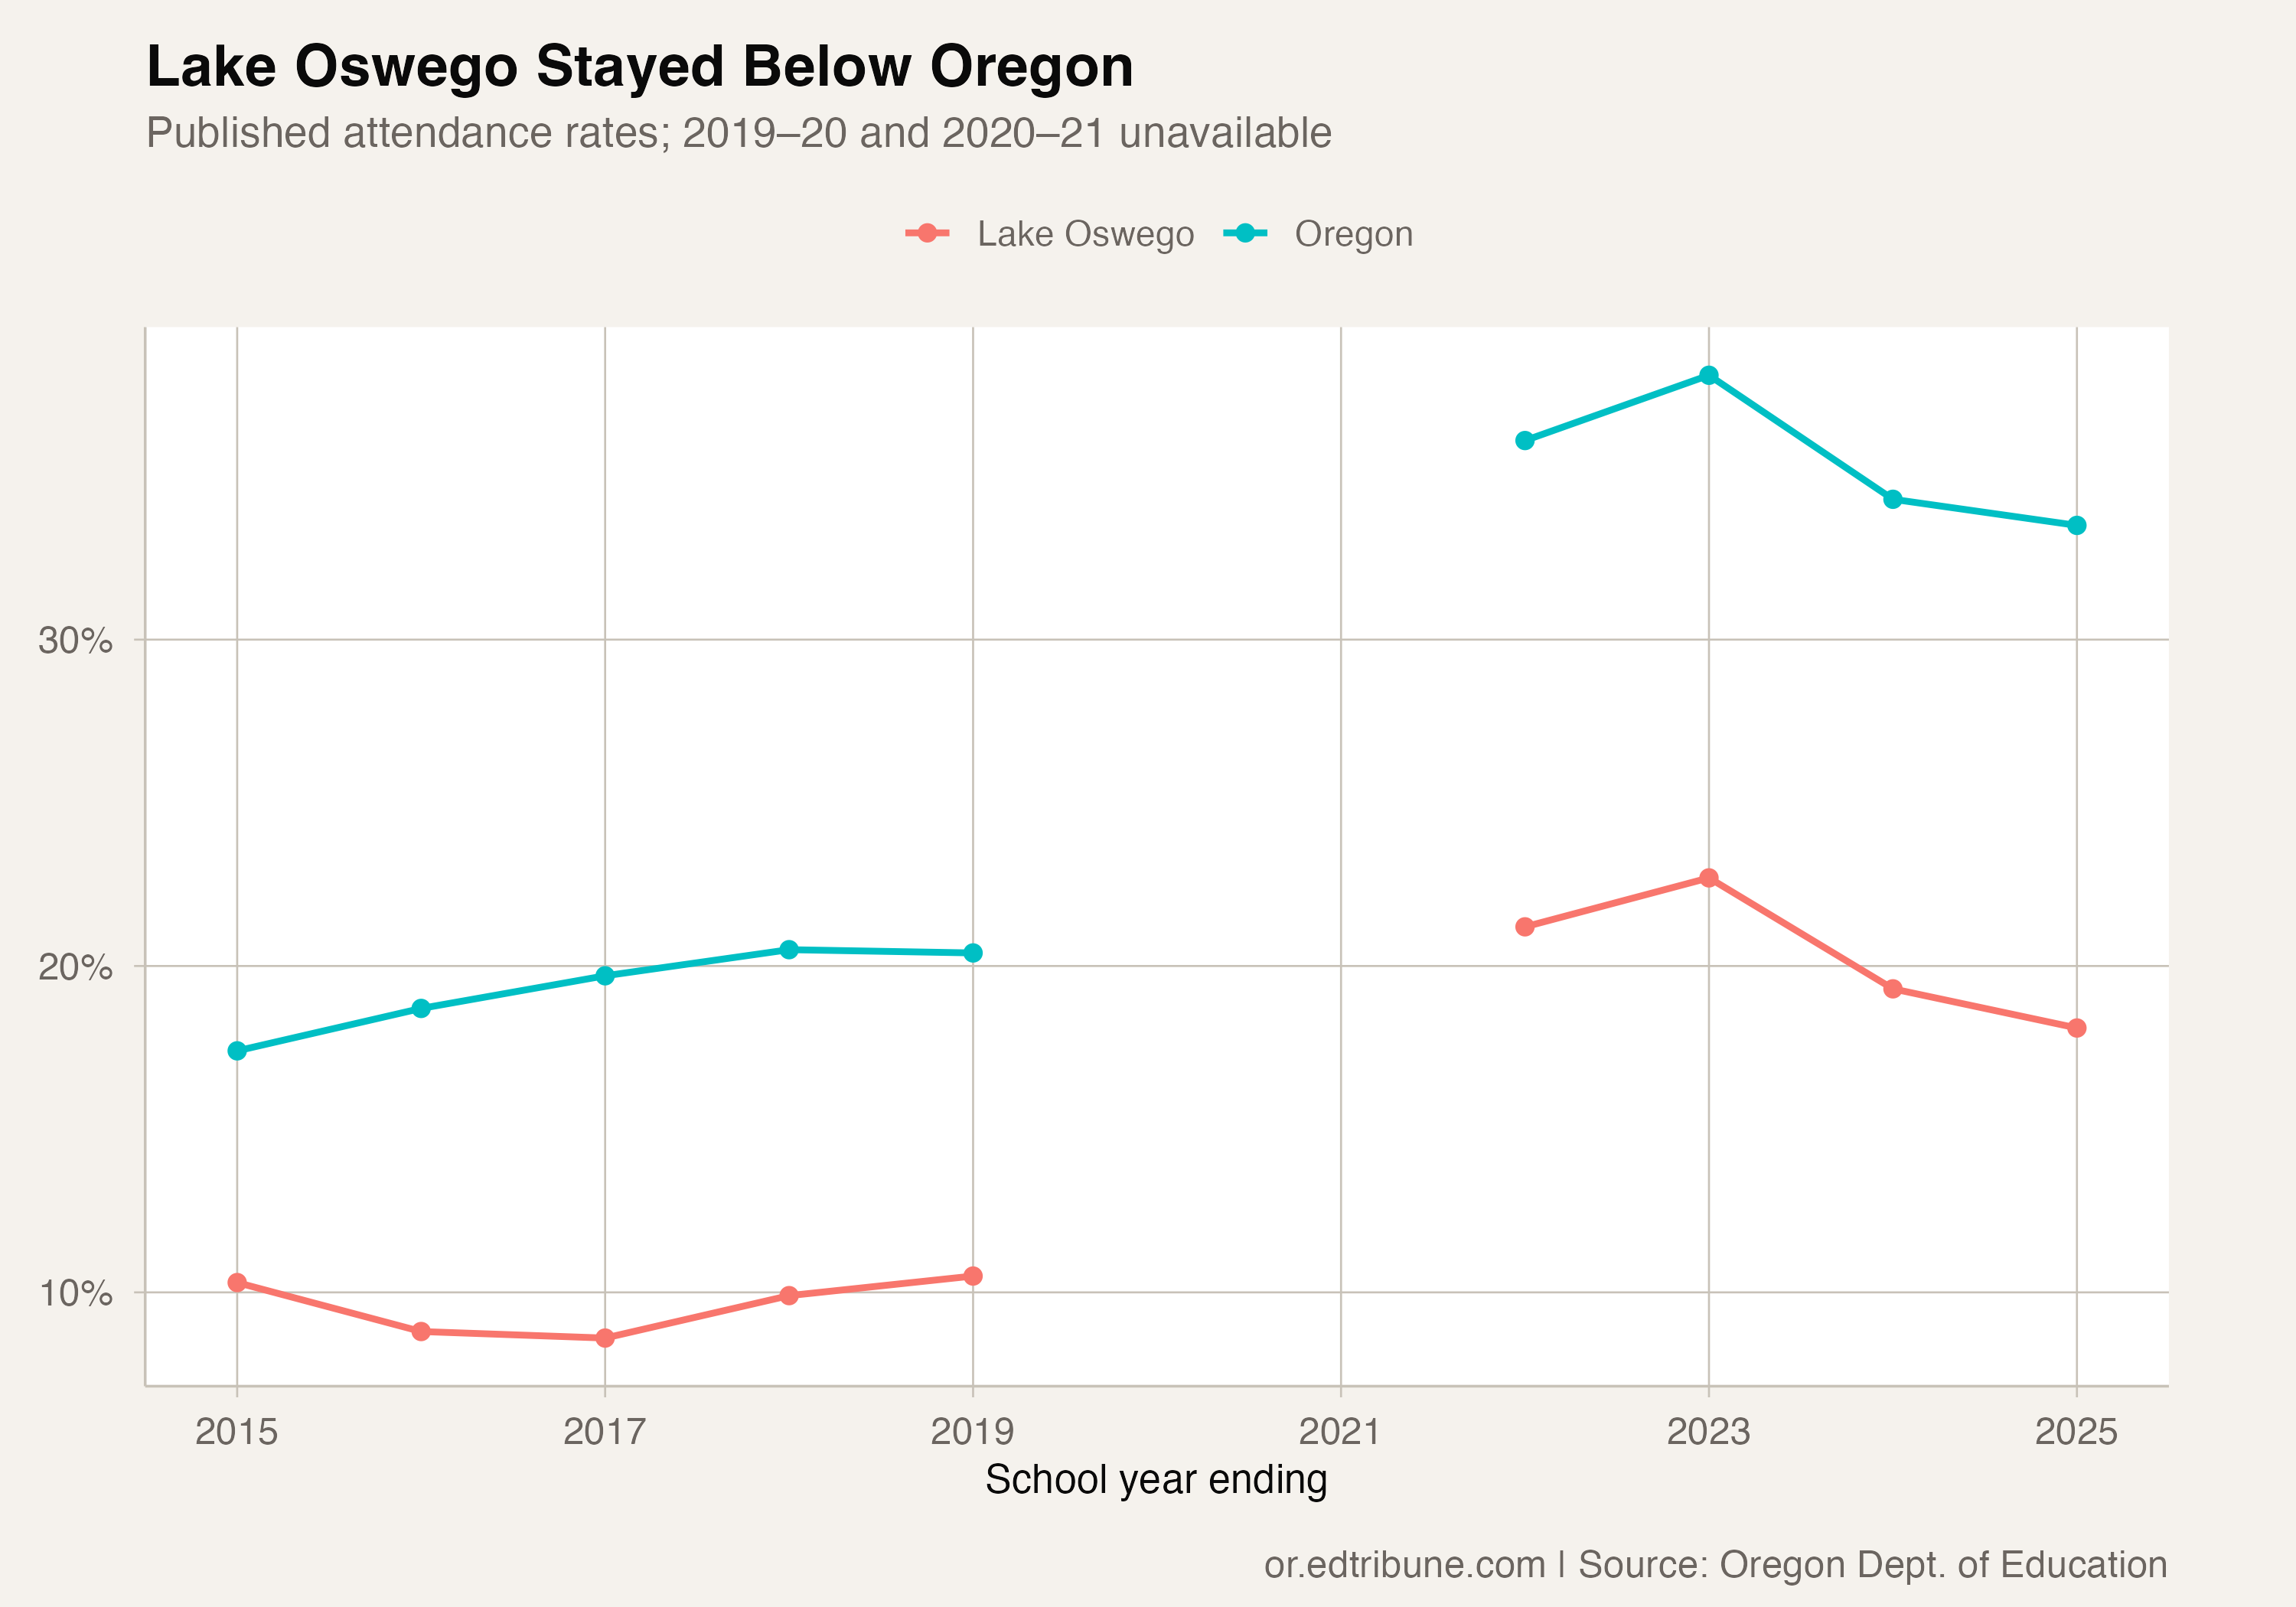
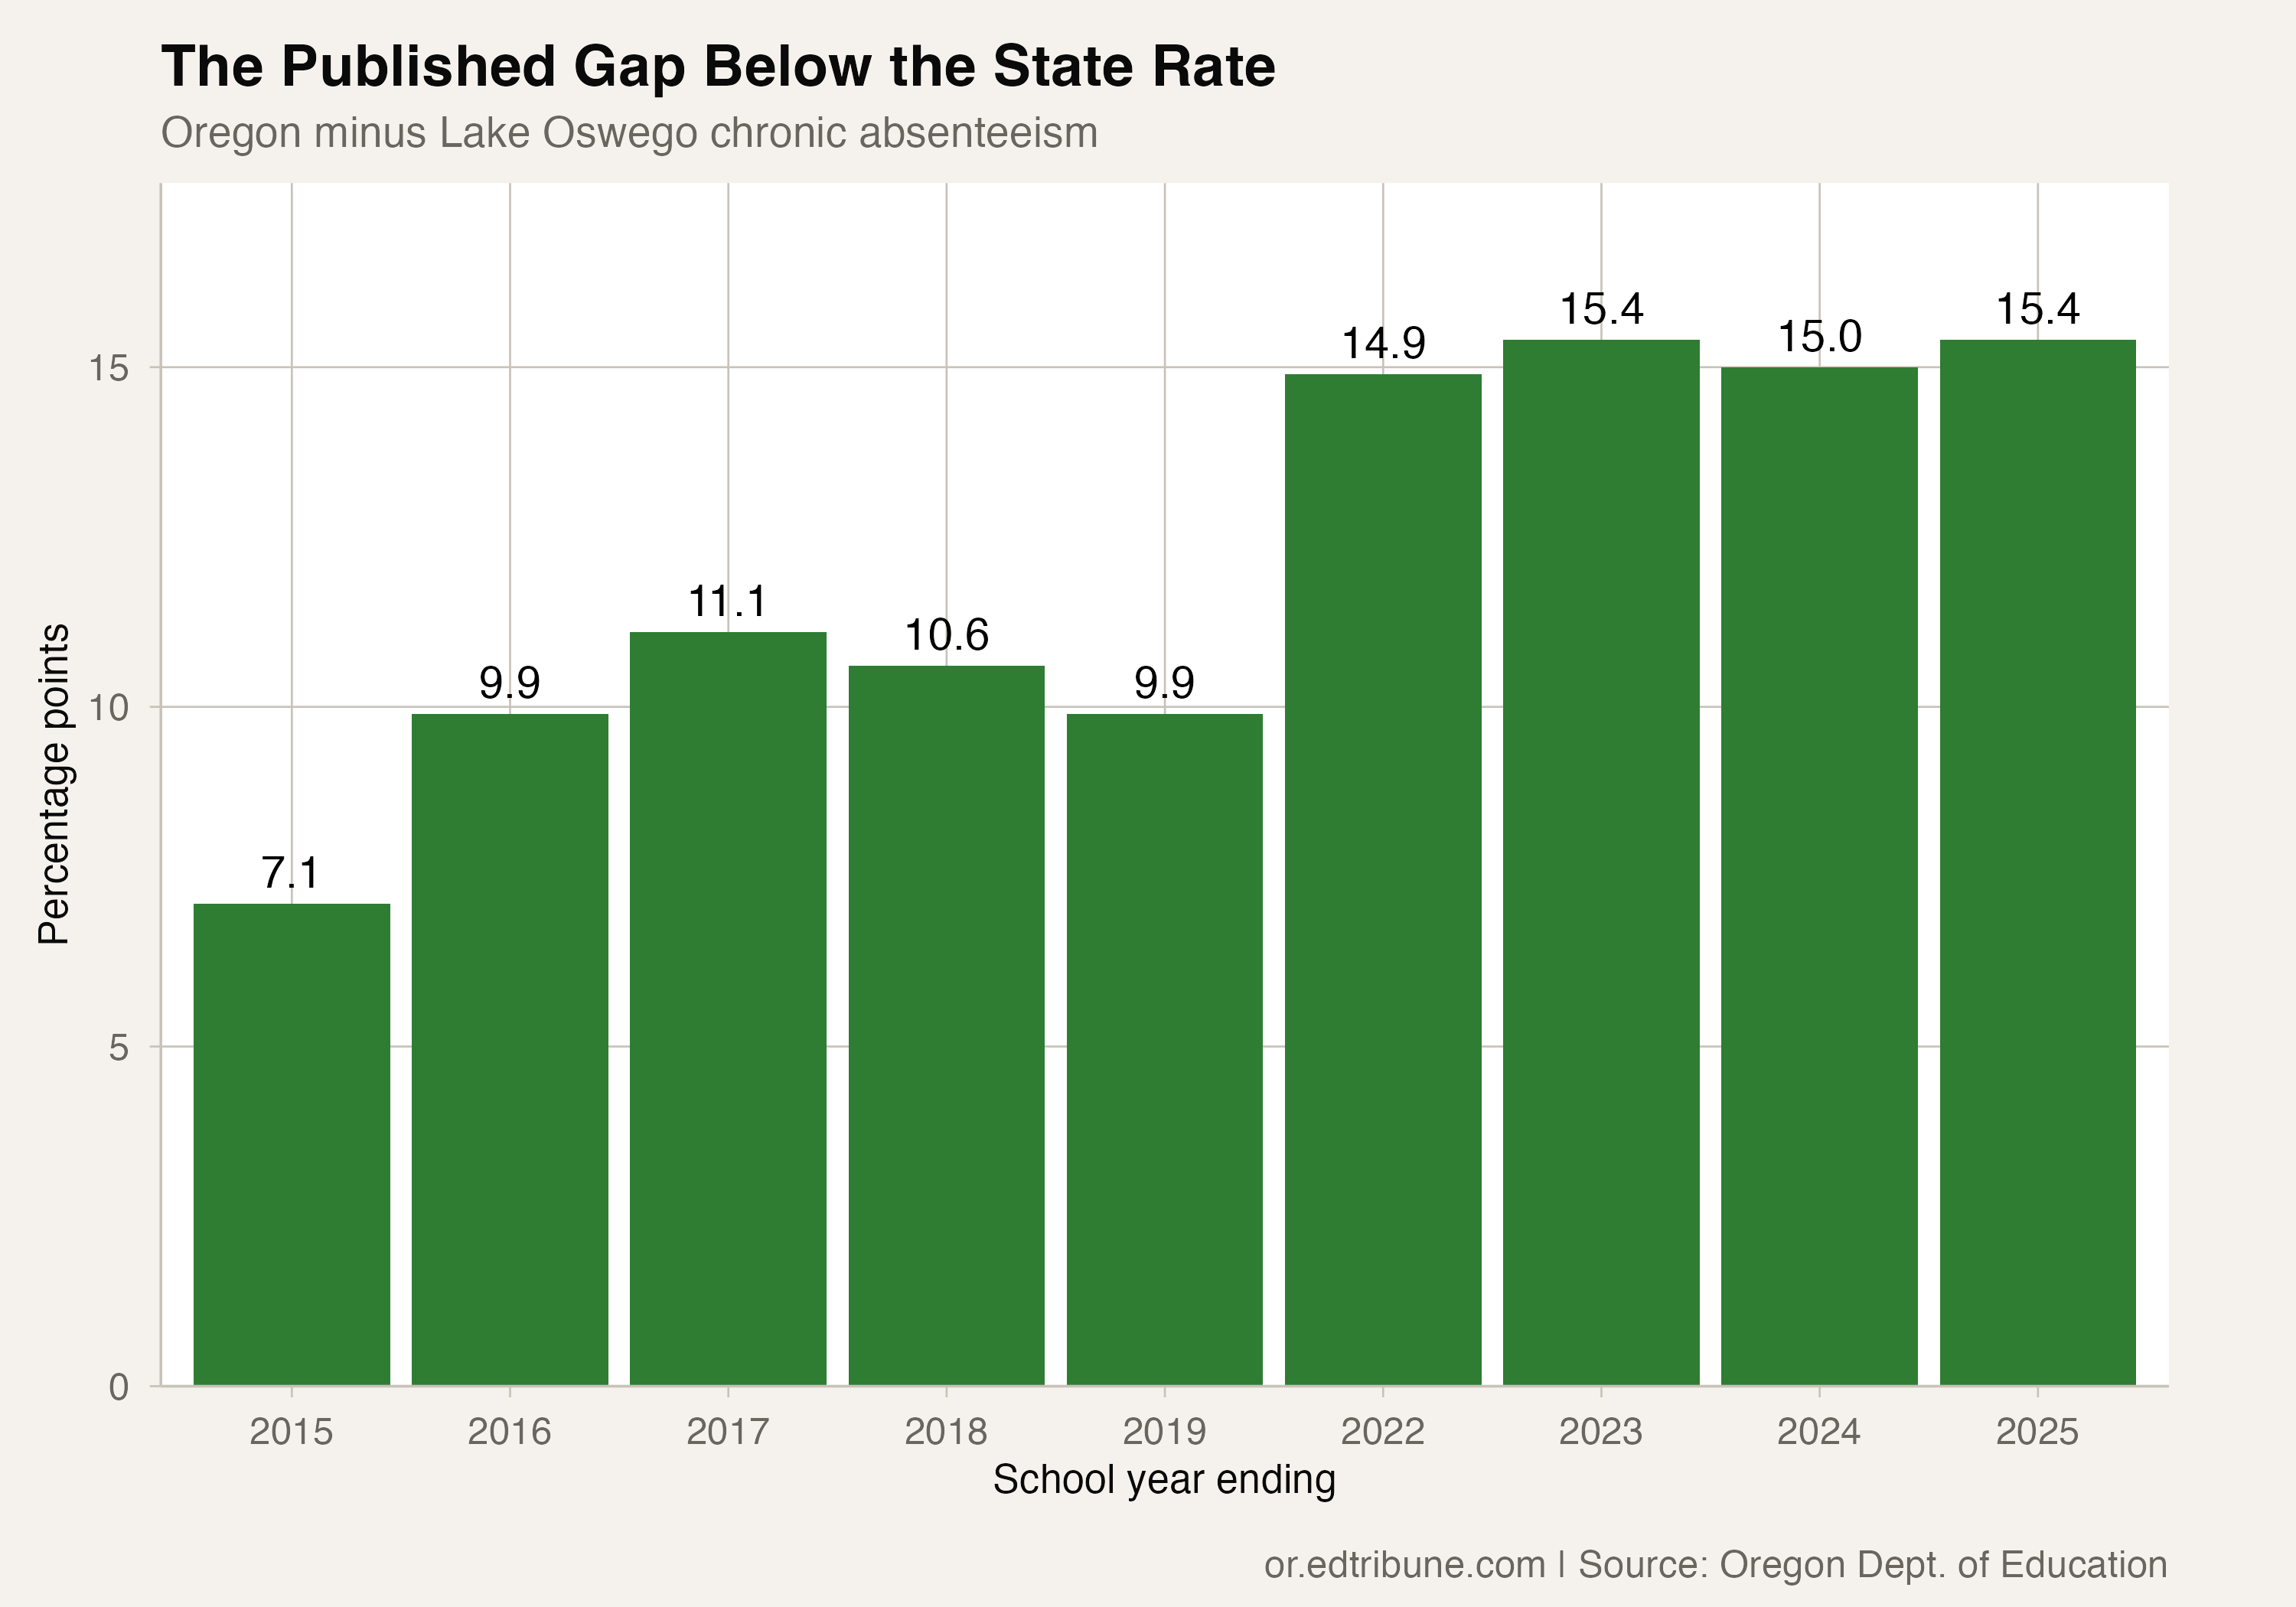
Lake Oswego School District↗ET reported chronic absenteeism of 18.1% in 2024-25, compared with Oregon's statewide rate of 33.5%. The district was 15.4 percentage points below the state in the most recent published attendance data.
Lake Oswego was below the state rate in all nine available reporting years. That is a consistent pattern across the published observations, rather than a streak of consecutive years: the series runs from 2014-15 through 2024-25 but has no comparable observations for 2019-20 or 2020-21.
Below the state, above its own earlier rate
Lake Oswego's chronic absenteeism rate was 10.3% in 2014-15, when the state rate was 17.4%. The difference then was 7.1 points.
In 2018-19, the district rate was 10.5% and the statewide rate was 20.4%, a gap of 9.9 points. By 2024-25, Lake Oswego remained 7.6 points above its own pre-pandemic rate, while the state was 13.1 points above its baseline.
The wider gap therefore coexisted with worse attendance than before the pandemic in both places. Being below the statewide rate did not mean Lake Oswego had regained its earlier attendance level.
Recovery from the peak was equal in points
Lake Oswego's highest rate in the available series was 22.7% in 2022-23. Oregon's statewide rate also peaked that year, at 38.1%. Both fell by 4.6 points through 2024-25.
The district thus maintained its gap from the state over that interval. The figures do not support a claim that Lake Oswego recovered faster when recovery is measured as a percentage-point decline from the peak.
Lowest among the larger attendance populations
Lake Oswego had the lowest 2024-25 chronic absenteeism rate among the 27 Oregon districts with published attendance enrollment of at least 5,000 students. The next-lowest district rate was 25.9%.
Its attendance enrollment was 6,747. That is the published denominator in the attendance files, rather than a live count for the current school year.
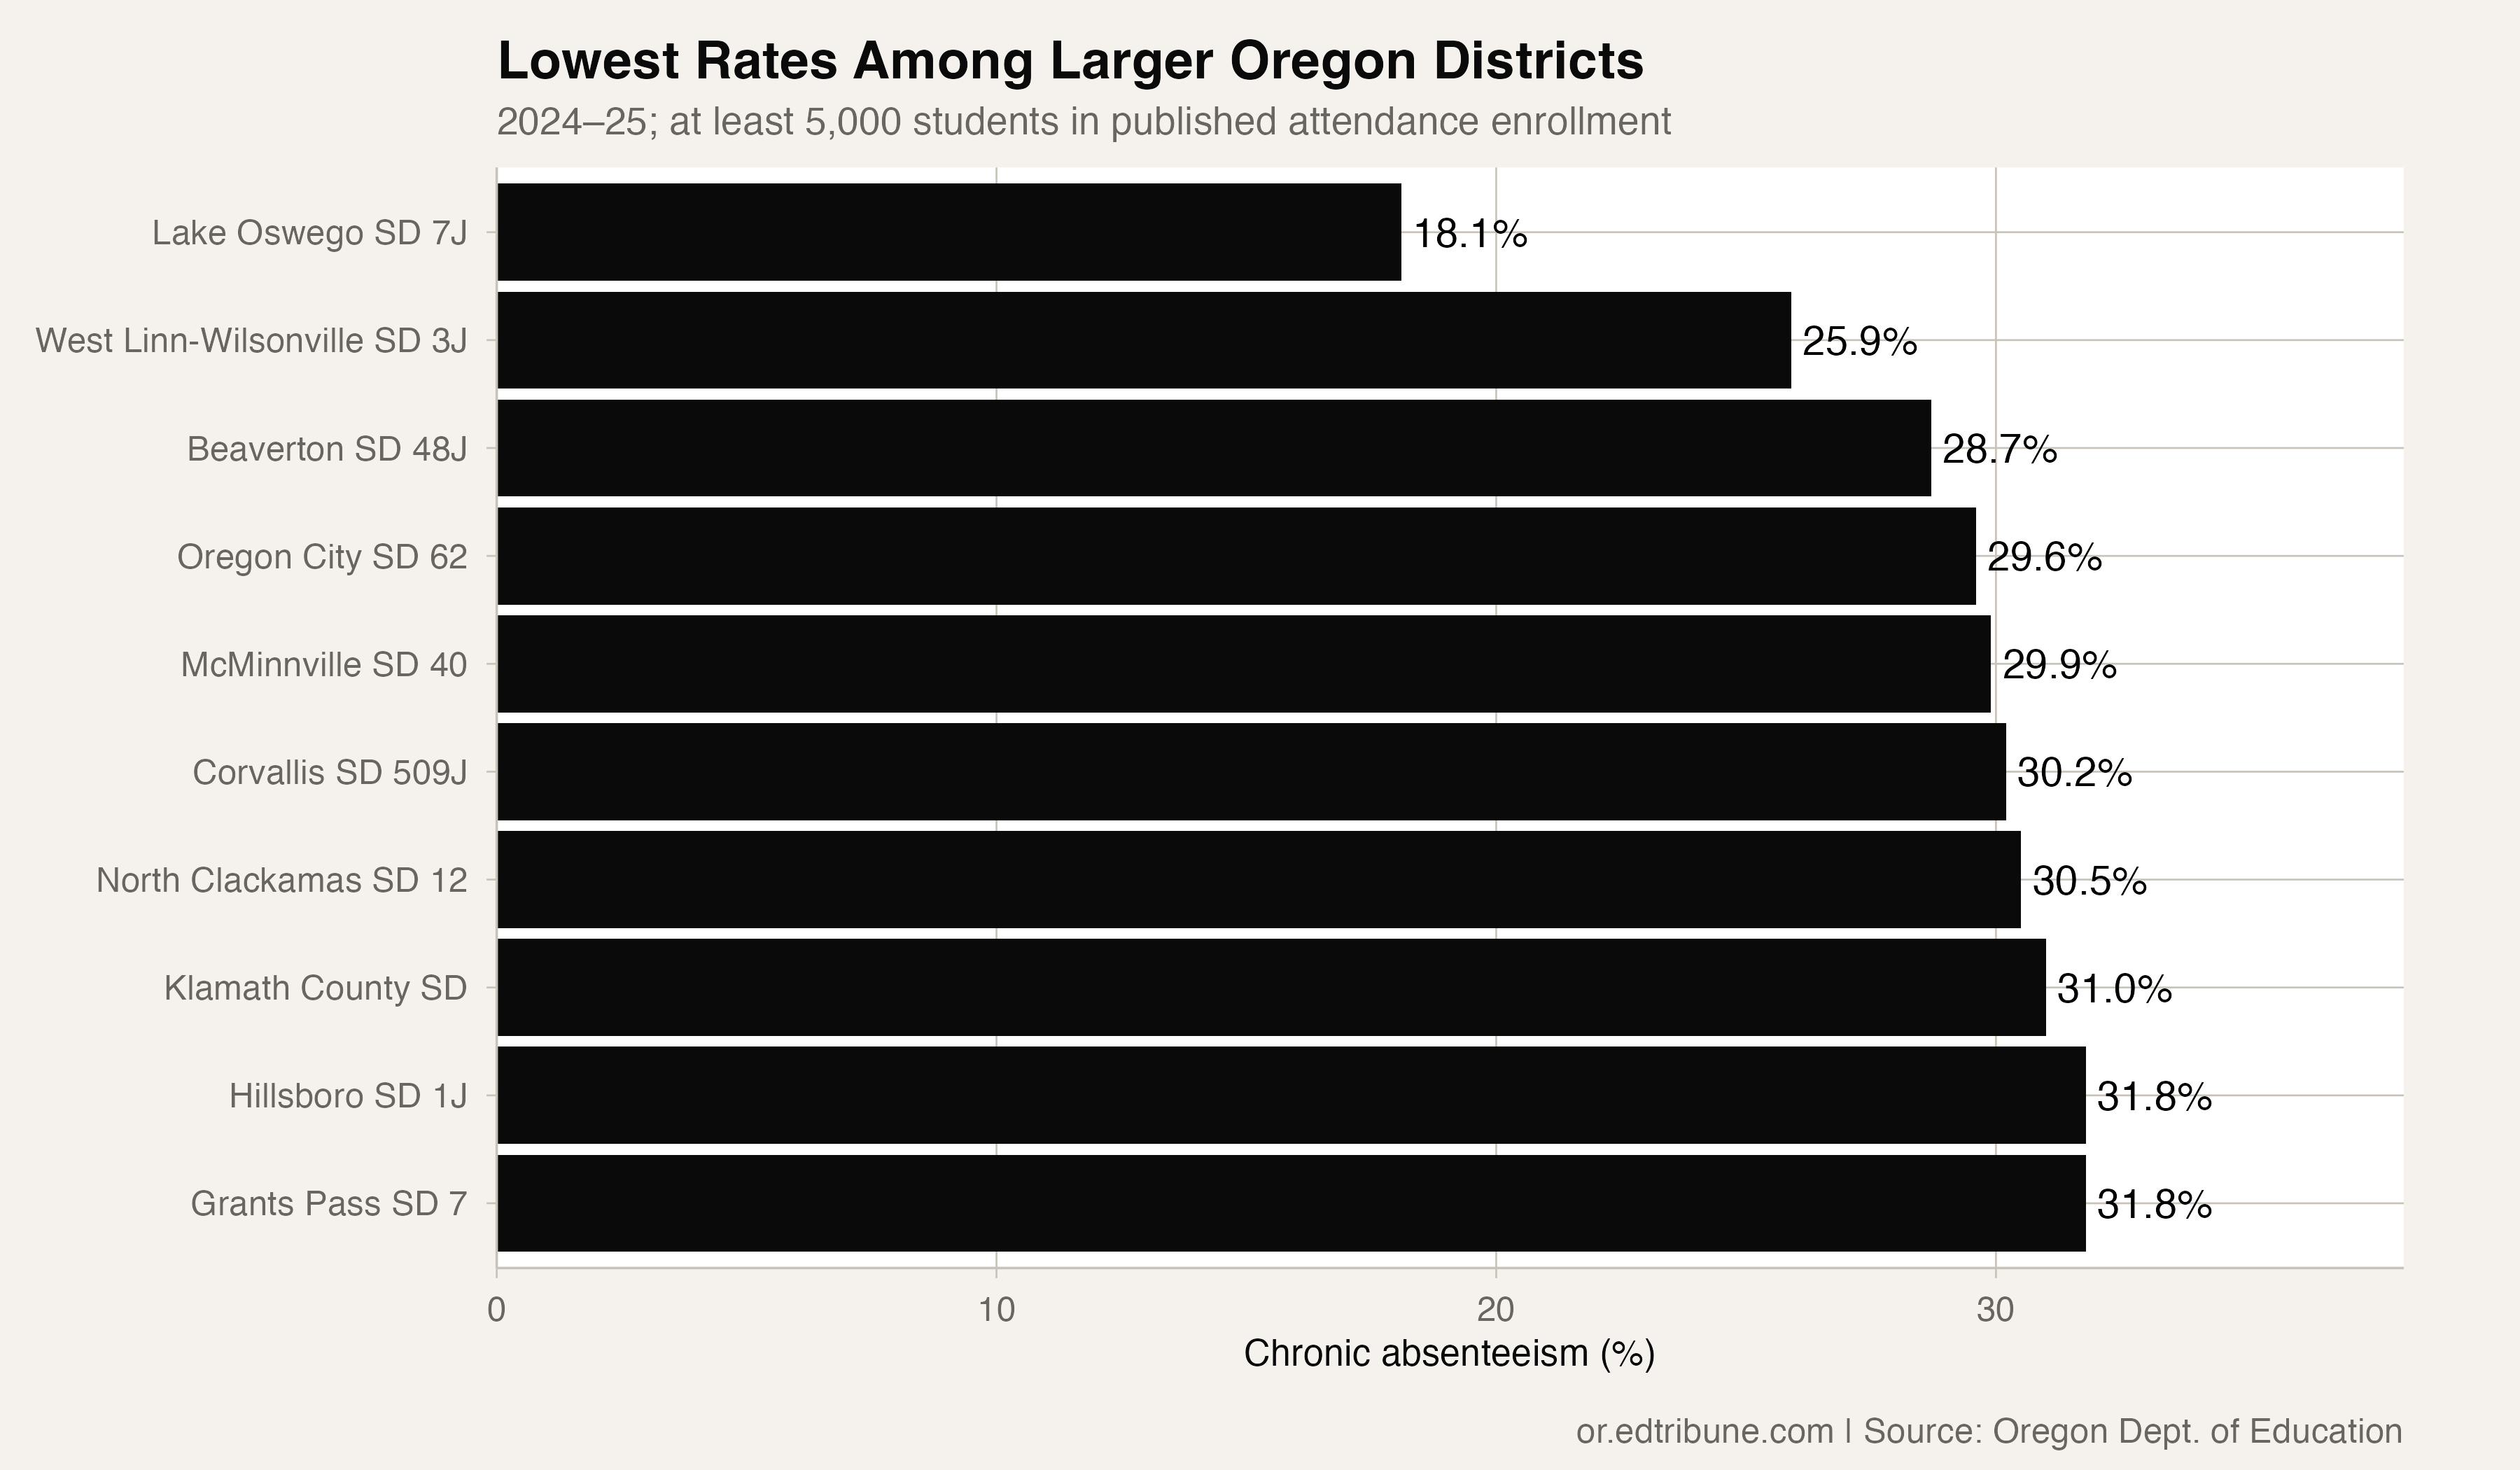
Lake Oswego was not the only larger district that stayed below the state rate across the available history. Seven districts meeting the latest-year size screen and having complete histories were below the state in every reported year.
Those comparisons identify a consistently lower-rate district and its position among peers. They do not isolate the causes. The attendance files do not establish whether family resources, transportation, health, district programs or other conditions explain the gap, or whether a particular approach would transfer elsewhere.
The distinction matters when interpreting Lake Oswego's results. Its latest rate was unusually low among larger districts, but it was still above the district's own pre-pandemic benchmark. Both findings belong in the same account of its attendance history.
Detailed code that reproduces the analysis and figures in this article is available exclusively to EdTribune subscribers.
Discussion
Sign in to join the discussion.
Loading comments...