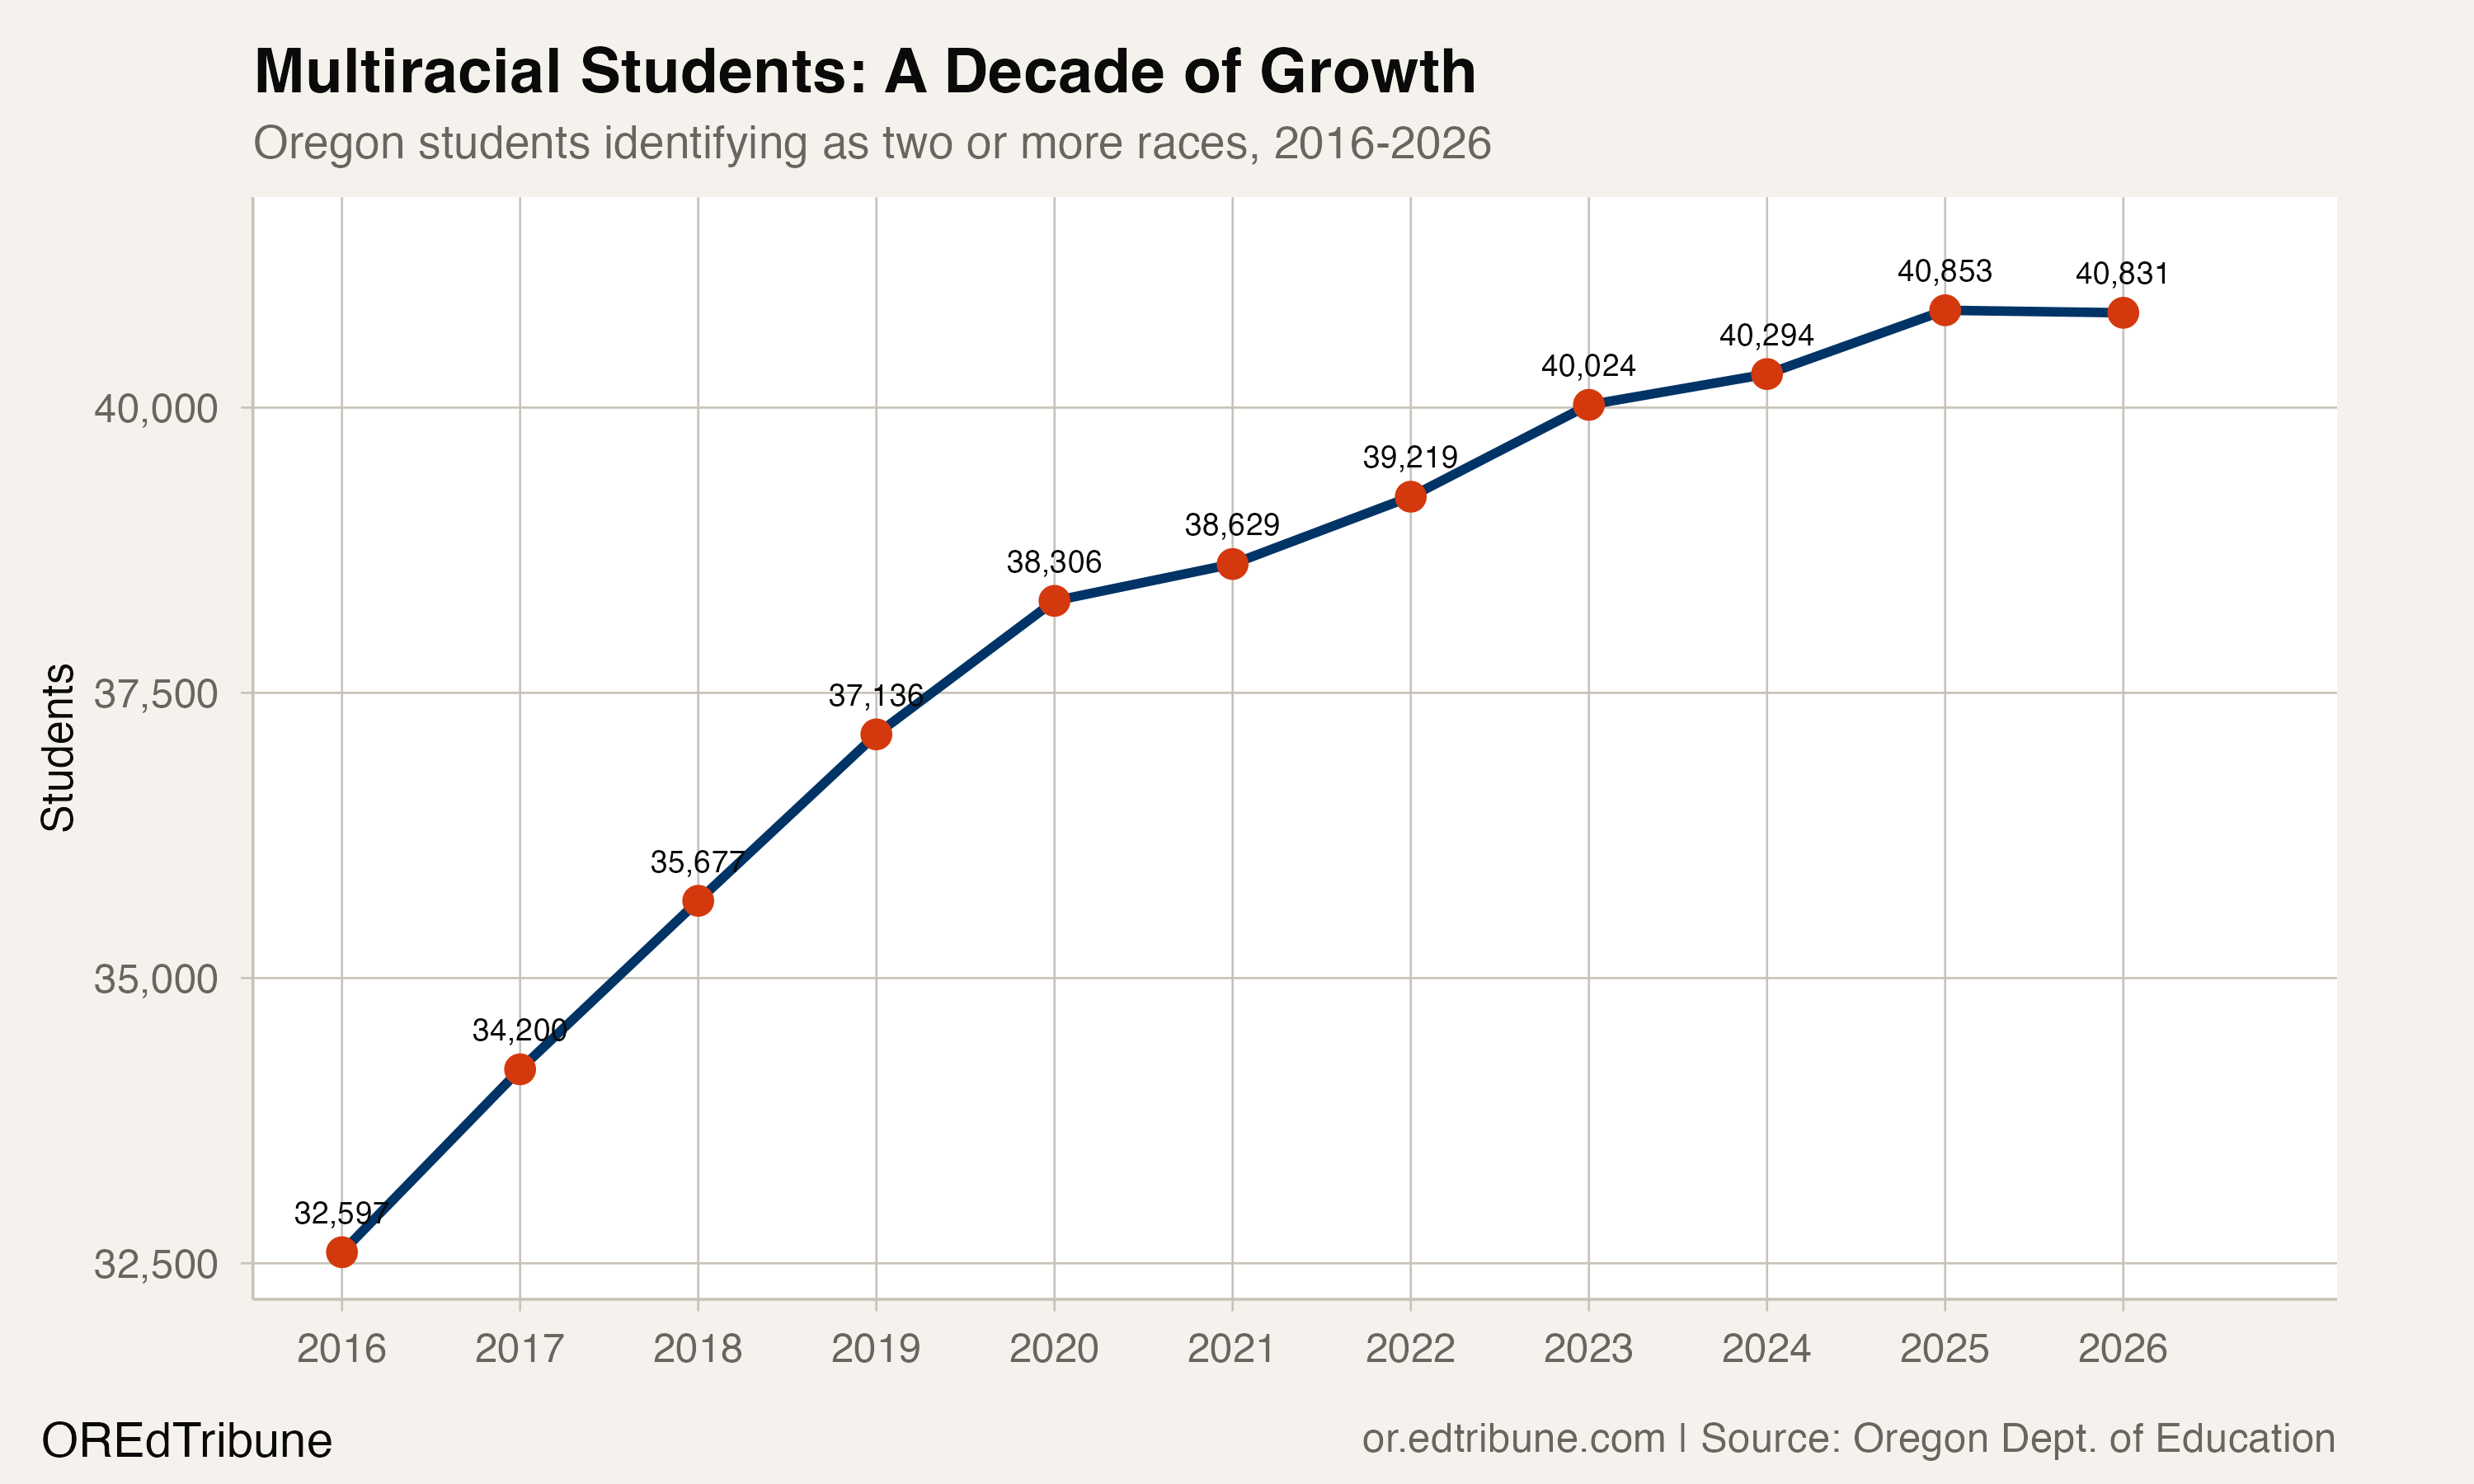
For a decade, one line on Oregon's enrollment charts moved in only one direction. While total enrollment fell 7.0% and white students disappeared at a rate of nearly 6,000 per year, the number of students identifying as two or more races climbed from 32,597 to 40,831. That 25.3% increase made multiracial students the fastest-growing racial group in Oregon's public schools by a wide margin.
Then, in 2026, the line went flat. For the first time in the dataset, multiracial enrollment dipped, by 22 students. The number is trivial. The signal is not.
A growth story with two distinct eras
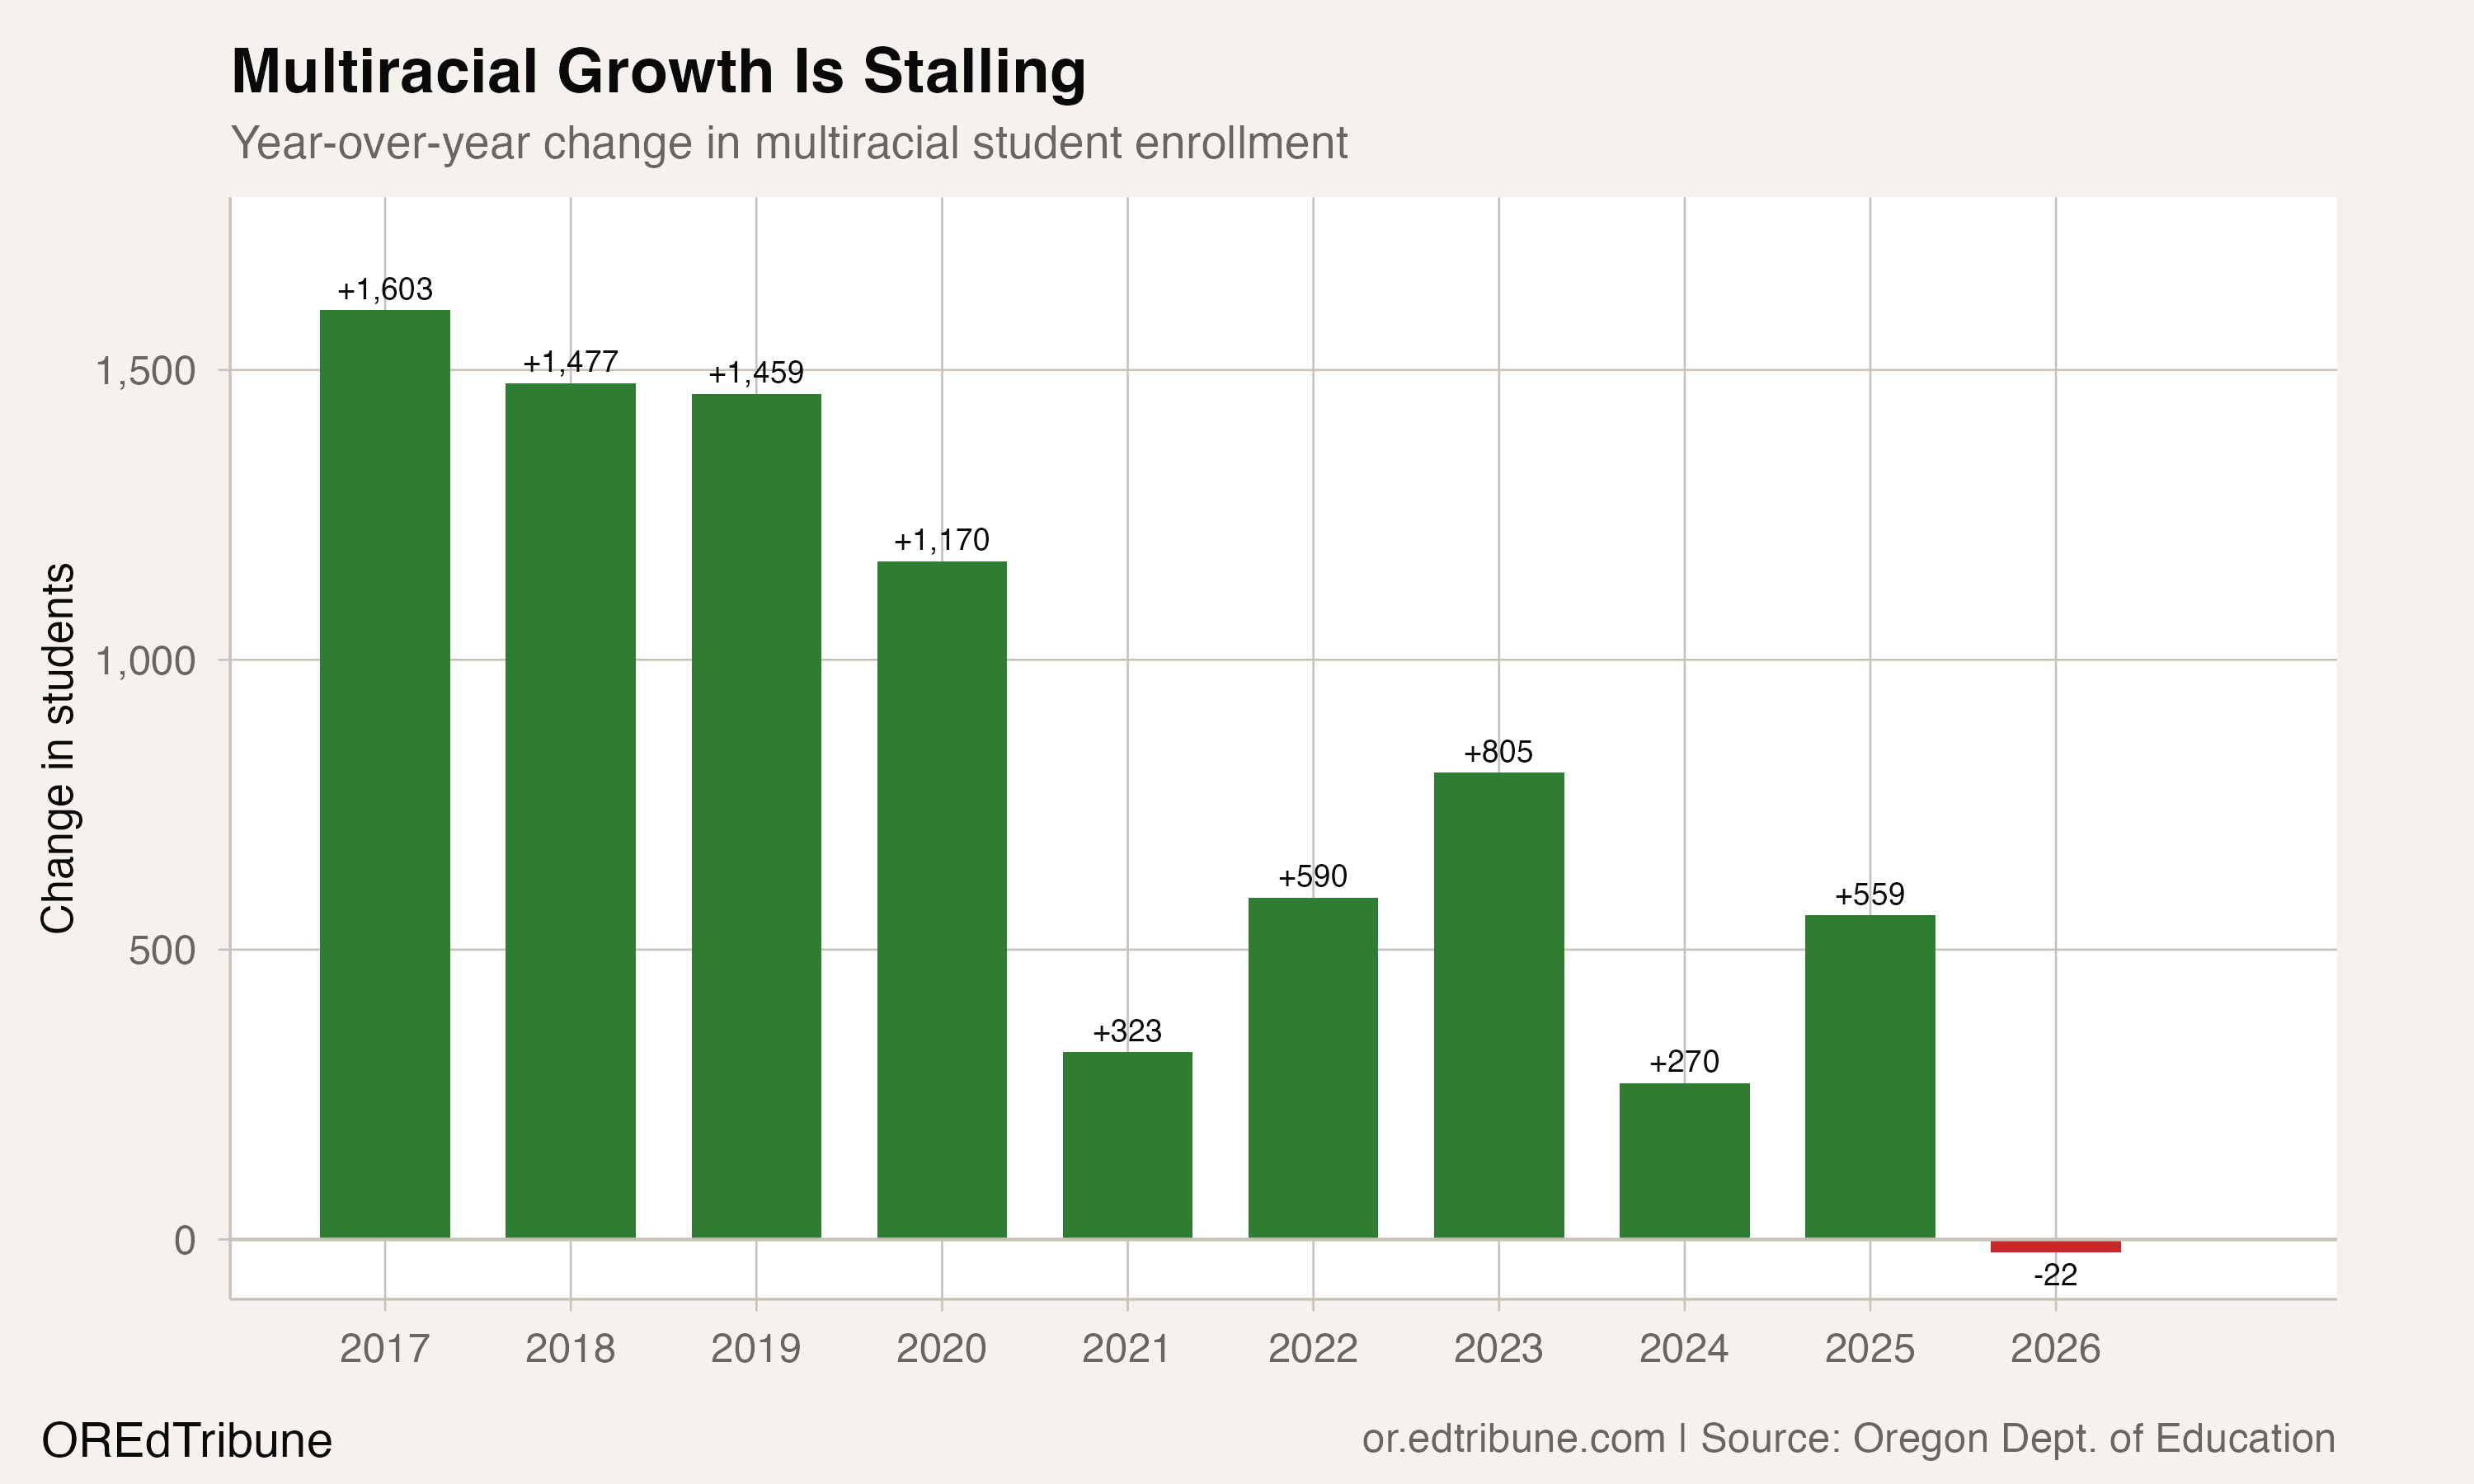
The multiracial surge was not constant. It arrived in two phases that look nothing alike.
From 2016 to 2020, Oregon added an average of 1,427 multiracial students per year. Growth ran at 3% to 5% annually, steady and strong enough to reshape classroom demographics across the state. After 2020, the pace collapsed. The post-COVID era averaged 421 new multiracial students per year, a 70% reduction in the annual rate. By 2024, the year-over-year gain had shrunk to 270 students. By 2026, it was negative.
The deceleration pattern matters because it complicates the most intuitive explanation for the growth: that interracial families are simply having more children. If the growth were purely demographic, driven by rising rates of interracial marriage and the children those marriages produce, the curve should be smooth and generational. Instead, it surged, stalled during COVID, partially recovered, and then flatlined.
What "multiracial" actually measures
Oregon adopted the federal two-question format for race and ethnicity data collection in 2010, following U.S. Department of Education guidelines. The first question asks whether a student is Hispanic or Latino. The second asks families to select one or more races. Any student whose family checks more than one box on the second question is reported as multiracial in Oregon's data system. There is no standalone "multiracial" checkbox.
This means the multiracial category captures two overlapping populations: children of interracial families and children whose families changed how they filled out the form. Distinguishing between the two is impossible with enrollment data alone.
Both forces are real. Pew Research Center found that one in seven U.S. infants were multiracial or multiethnic in 2015, nearly triple the share in 1980, driven by interracial marriages rising from 7% to 17% of all newlyweds over the same period. Oregon's general population is 10.8% multiracial according to recent Census estimates, well above the state's 7.6% school enrollment share, suggesting the K-12 number has room to grow if demographics are the primary driver.
At the same time, the Census Bureau's own researchers have acknowledged that improved race and ethnicity measures accounted for much of the apparent explosion in multiracial identification nationally. The 2020 Census recorded 33.8 million multiracial Americans, up from 9 million in 2010, a 276% increase that the Bureau attributed largely to question design and coding changes rather than actual population growth. A similar dynamic could be at work in school enrollment forms, where small shifts in how families interpret the race question ripple through the data.
The geography of multiracial enrollment
The growth was not spread evenly. Portland Public Schools, where one in eight students identifies as multiracial, accounts for 1,099 of the statewide gain of 8,234, or 13.3%. Portland's multiracial share rose from 8.9% to 12.9% over the decade, even as the district lost 6,277 students overall.
The suburban ring around Portland tells a similar story. North Clackamas grew its multiracial enrollment by 51.9%, adding 586 students. Tigard-Tualatin added 310 (+41.0%). Gresham-Barlow added 315 (+44.4%). Lake Oswego, one of the state's most affluent districts, saw its multiracial share jump from 6.9% to 12.5%.
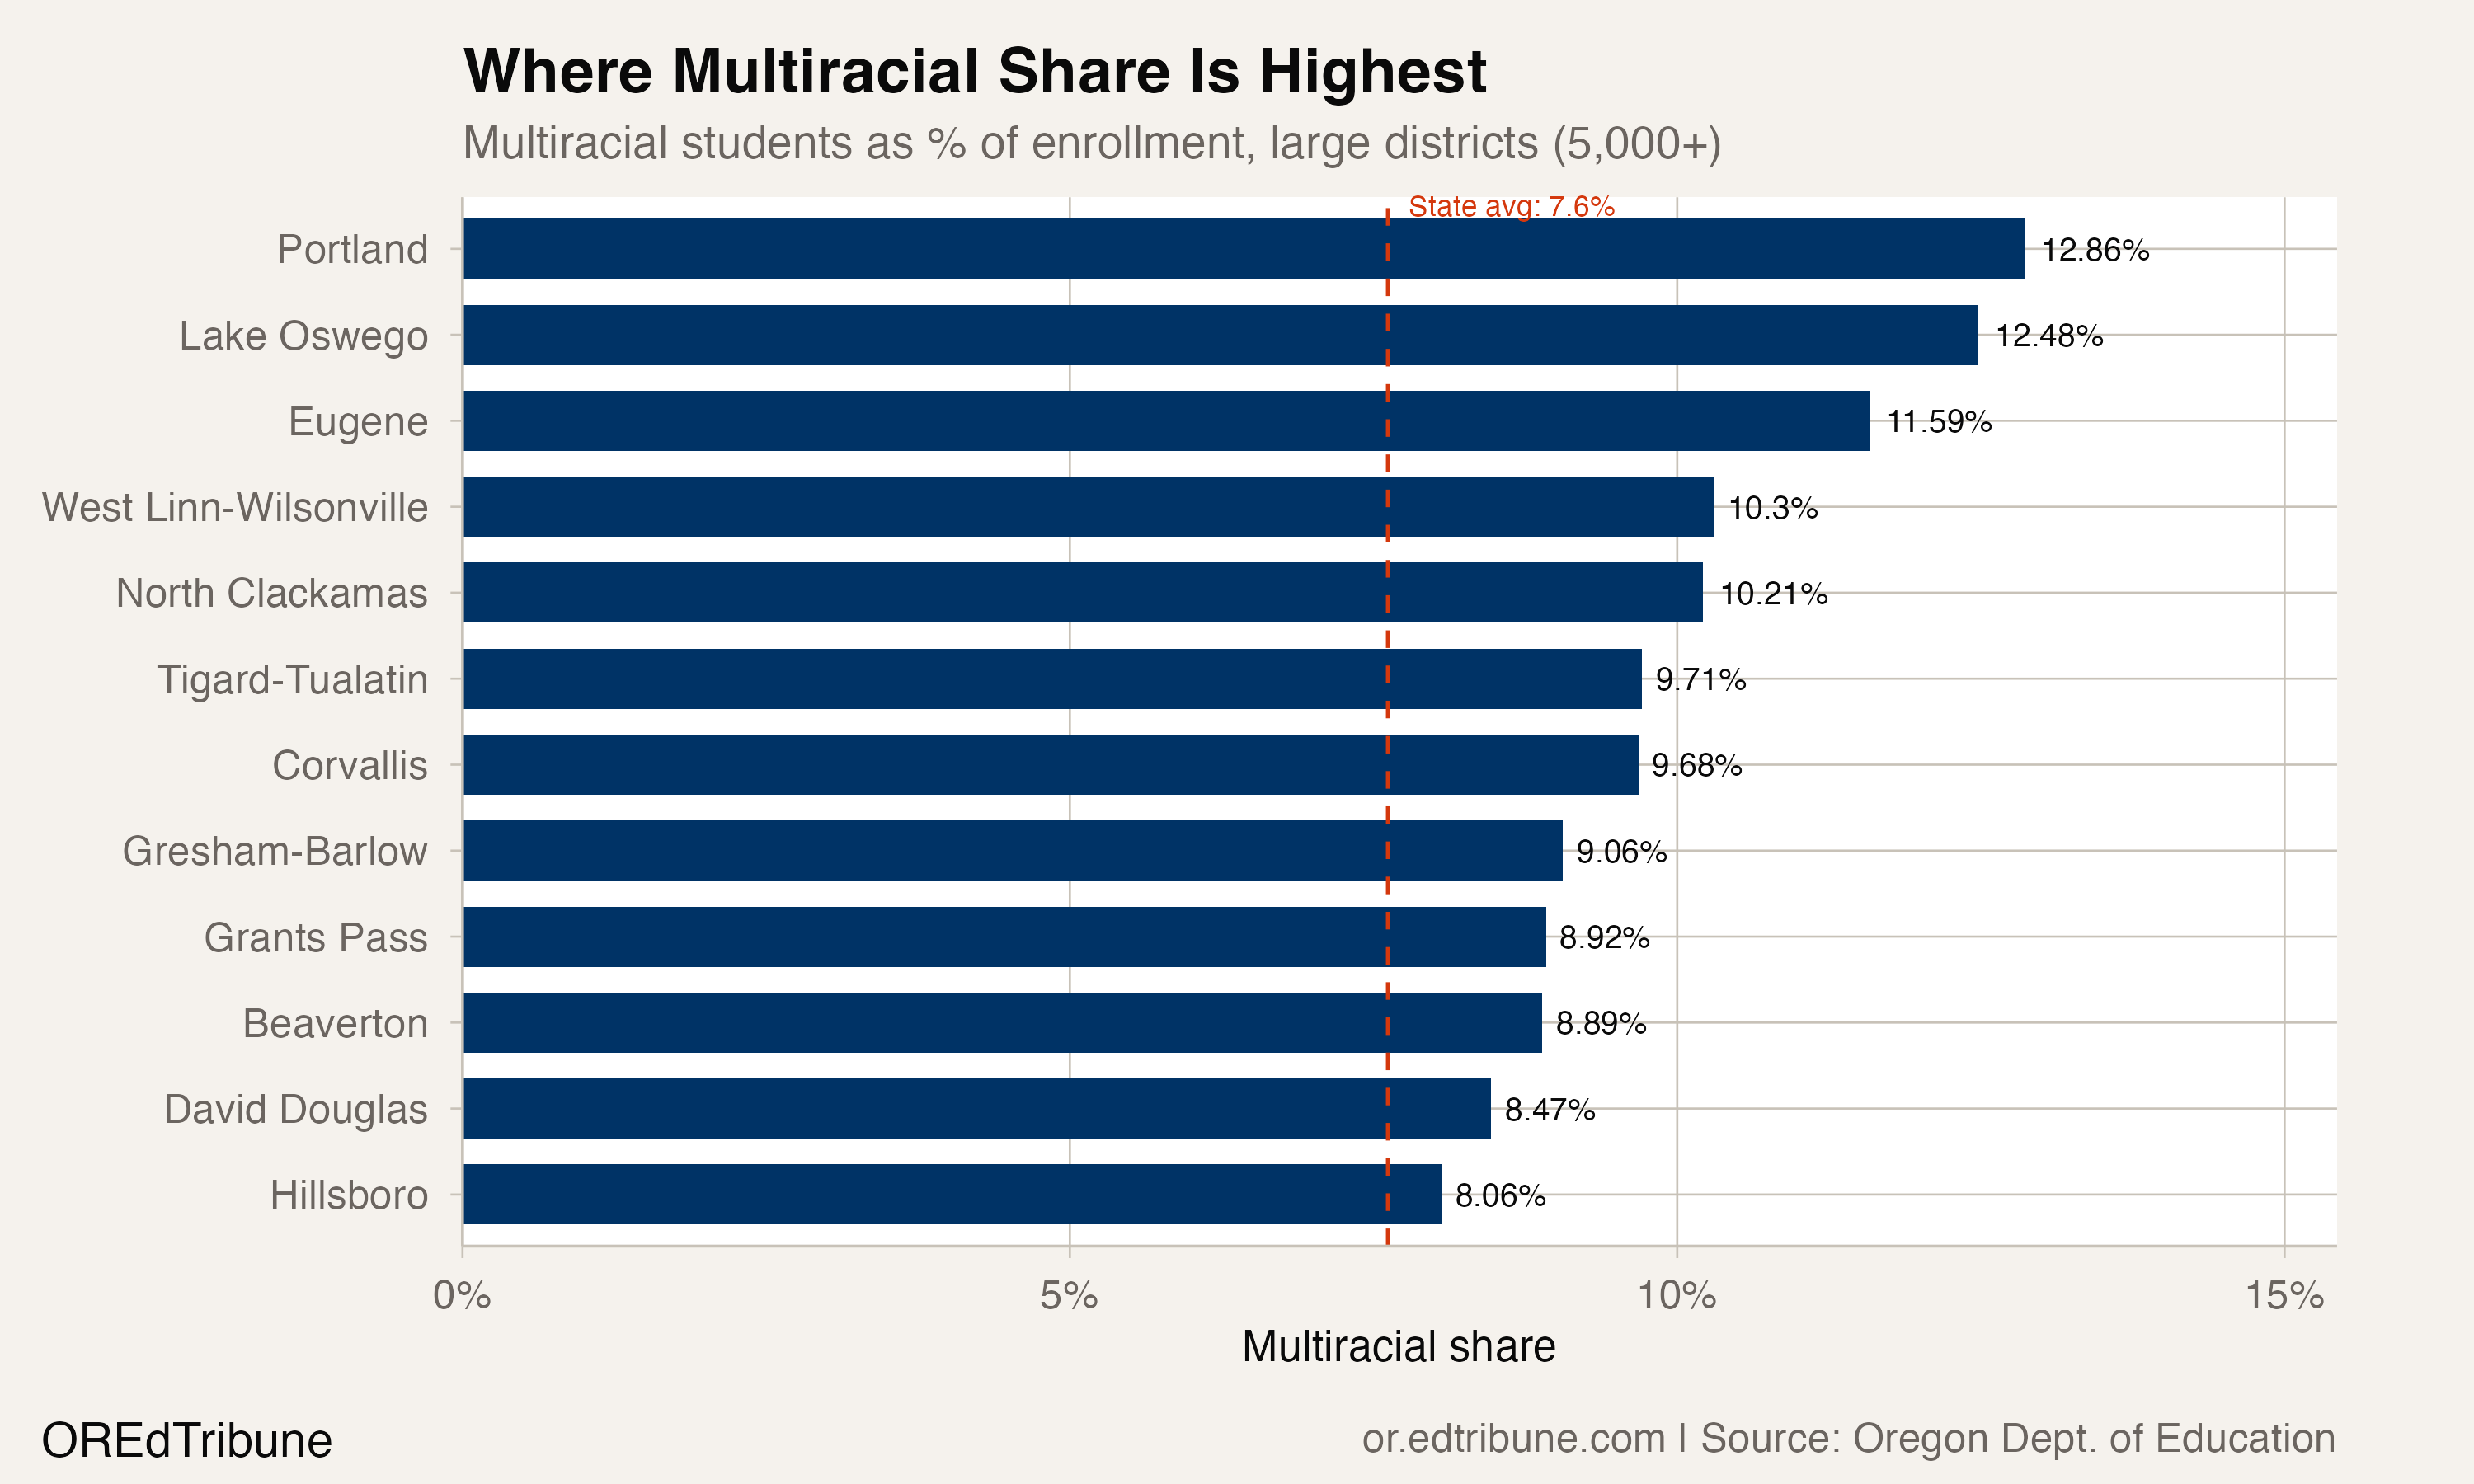
The pattern is geographically concentrated. Among the 12 large districts where multiracial students exceed the state average of 7.6%, all but two (Eugene and Grants Pass) sit in the Portland metro area or the northern Willamette Valley. Salem-Keizer, Oregon's second-largest district with 36,661 students, has a multiracial share of just 6.3%. Woodburn, a majority-Hispanic district of 5,107 students south of Portland, reports 0.6%.
Bend-LaPine, the fastest-growing large district by percentage, saw its multiracial enrollment jump 115.1% from 410 to 882 students. But the share remains modest at 5.3%, well below the metro Portland districts.
Why the line is bending
"Enrollment increased between fall 2012 and fall 2022 among students who were of Two or more races (1.4 million to 2.5 million)." -- National Center for Education Statistics, 2024
Oregon's pattern mirrors a national trajectory. Nationally, multiracial K-12 enrollment ran 12% above pre-pandemic levels by fall 2022, the strongest recovery of any racial group. But the same NCES data shows the rate of increase slowing, suggesting Oregon may be part of a broader plateau.
Three mechanisms are plausible. The first is demographic: more multiracial children are aging into the school system as interracial marriages that accelerated in the 2000s and 2010s produce school-age children. This is likely the primary long-term driver, supported by the Pew data on interracial births. The second is identification shift: families who previously checked a single box are now checking multiple boxes, whether because of evolving attitudes about racial identity, clearer form instructions, or social norms that make multiracial identification more common. The third, specific to the 2026 plateau, is that the identification-shift component may be exhausted. Families who were going to update their forms have largely done so. What remains is the slower, steadier demographic component.
The federal government's 2024 revision to Statistical Policy Directive No. 15 will combine race and ethnicity into a single question by 2029, which could alter these counts again. Oregon's schools will need to adopt the new format, potentially reshuffling how students are categorized.
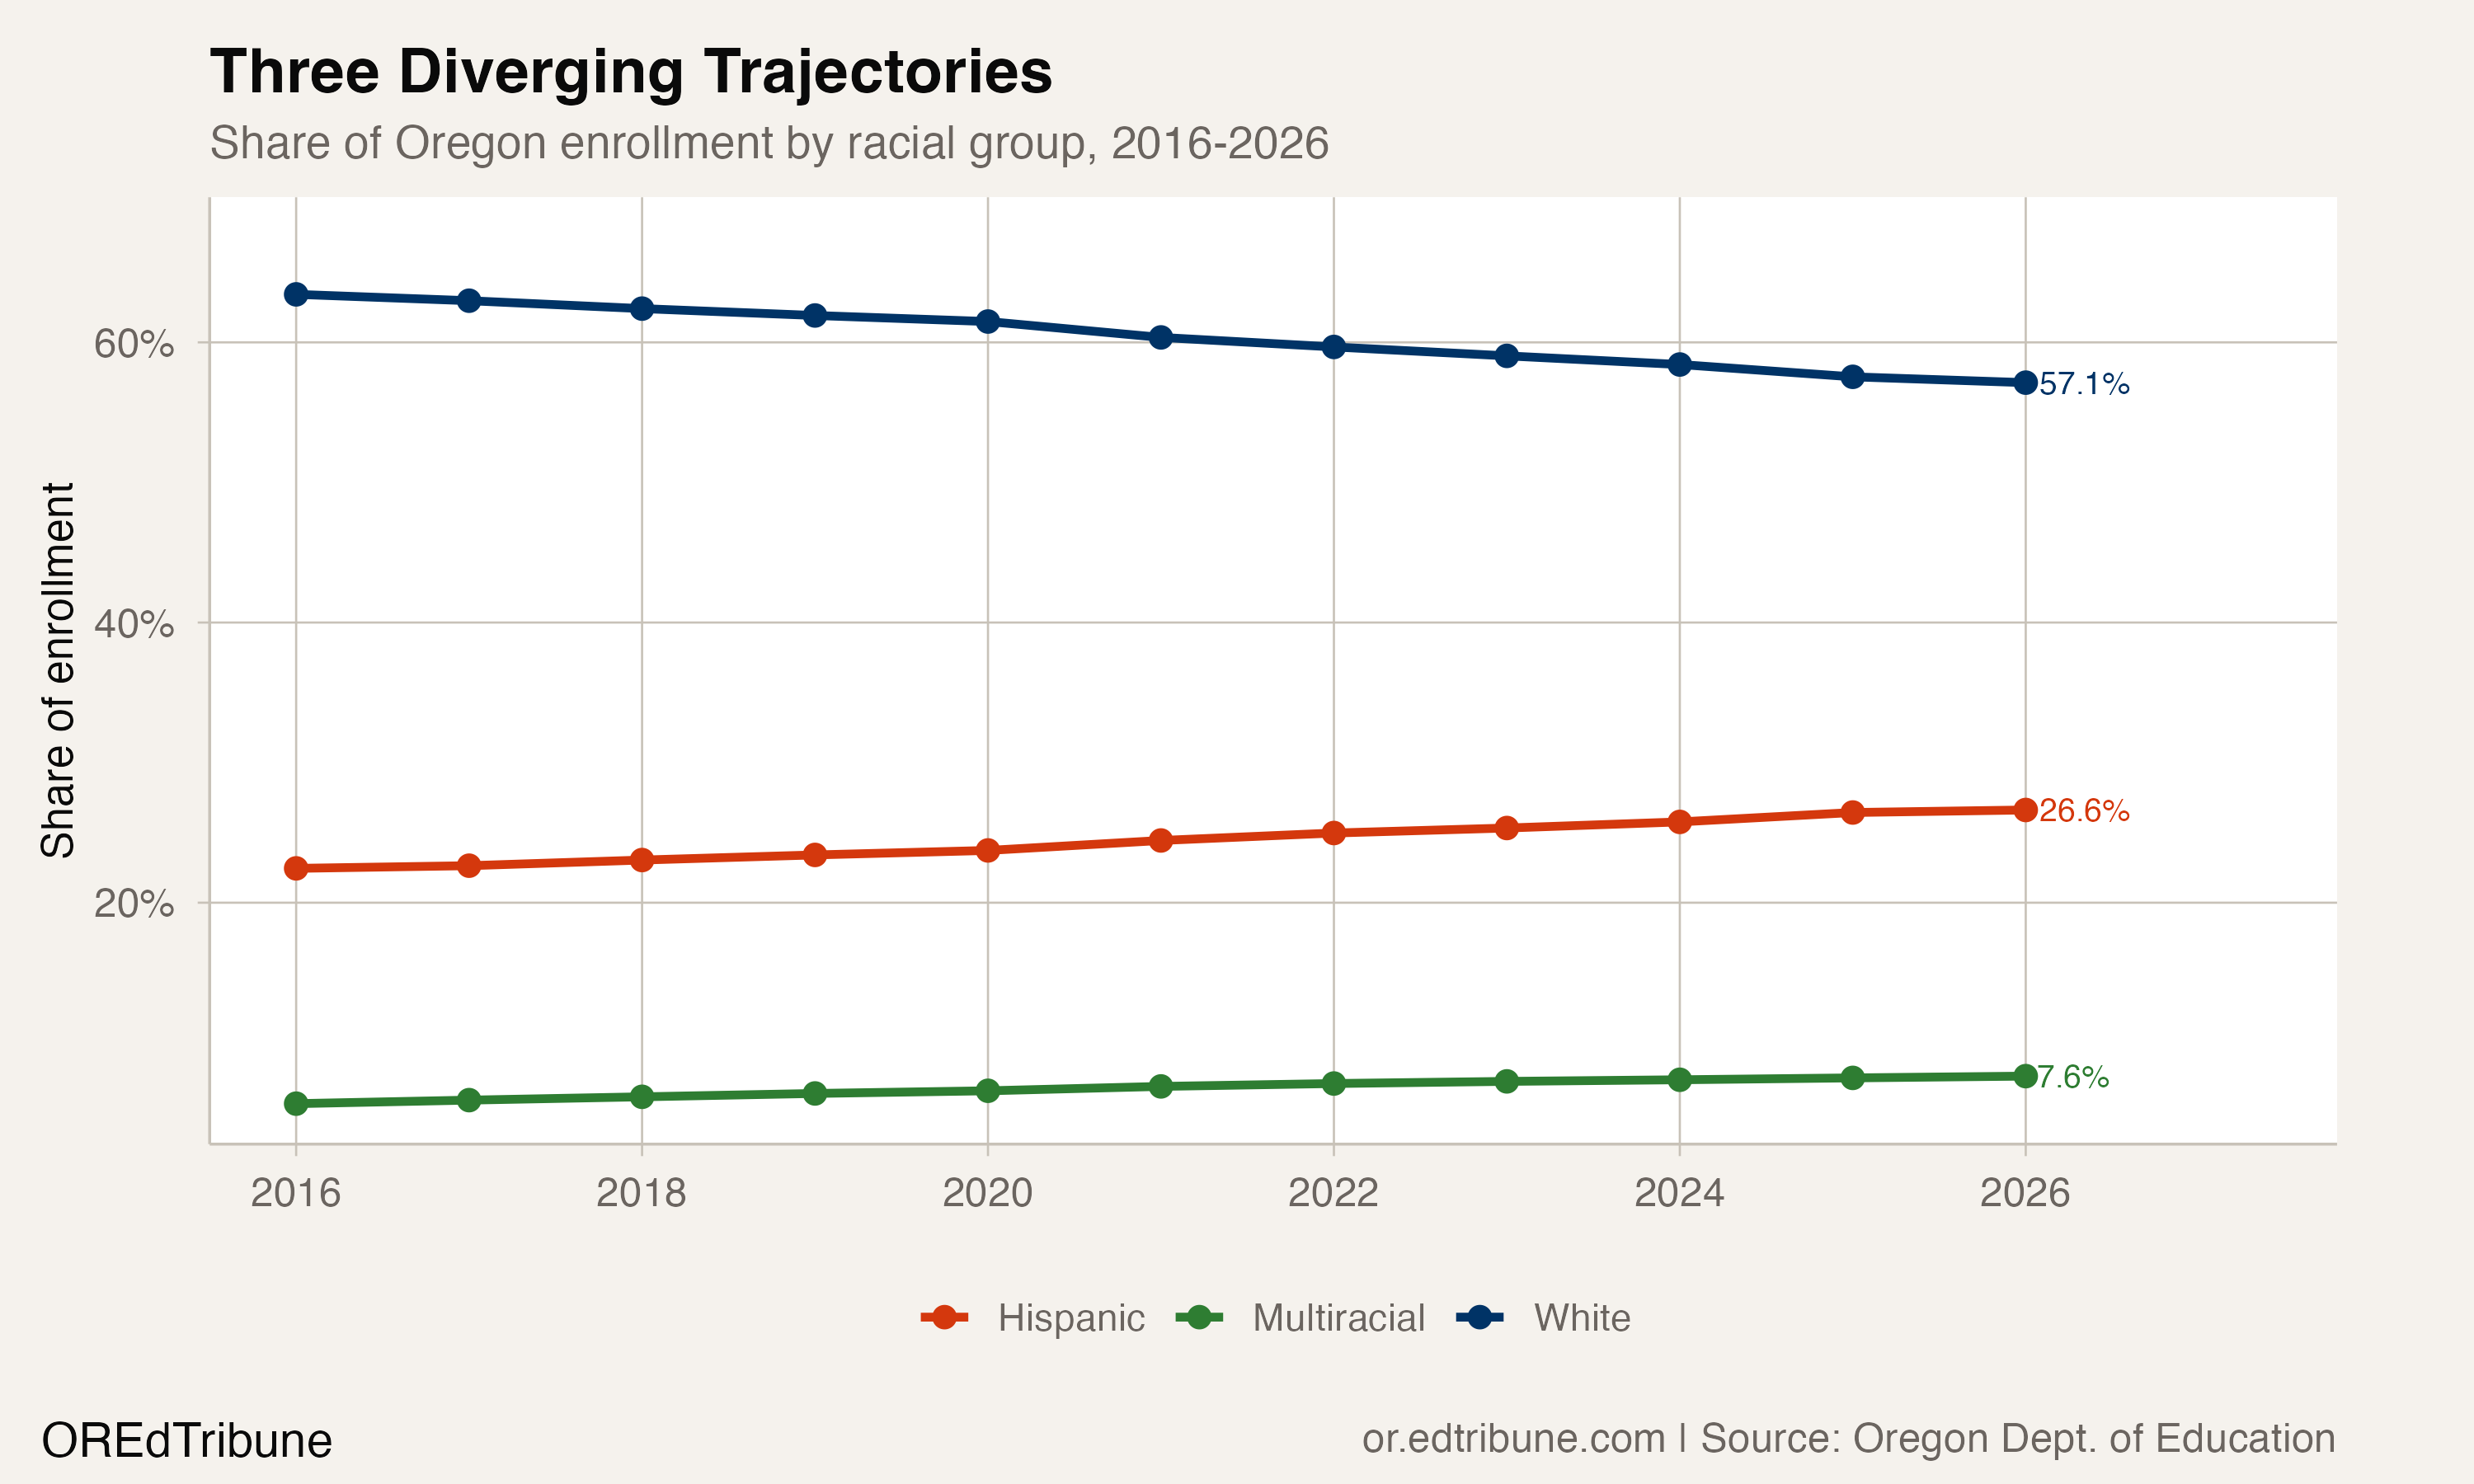
The composition picture
Multiracial growth is one strand of a broader transformation. Oregon's white student share fell 6.3 percentage points over the decade, from 63.4% to 57.1%. Hispanic students gained 4.2 points, reaching 26.6%. Multiracial students gained 2.0 points. Together, these three groups account for the overwhelming majority of the compositional shift.
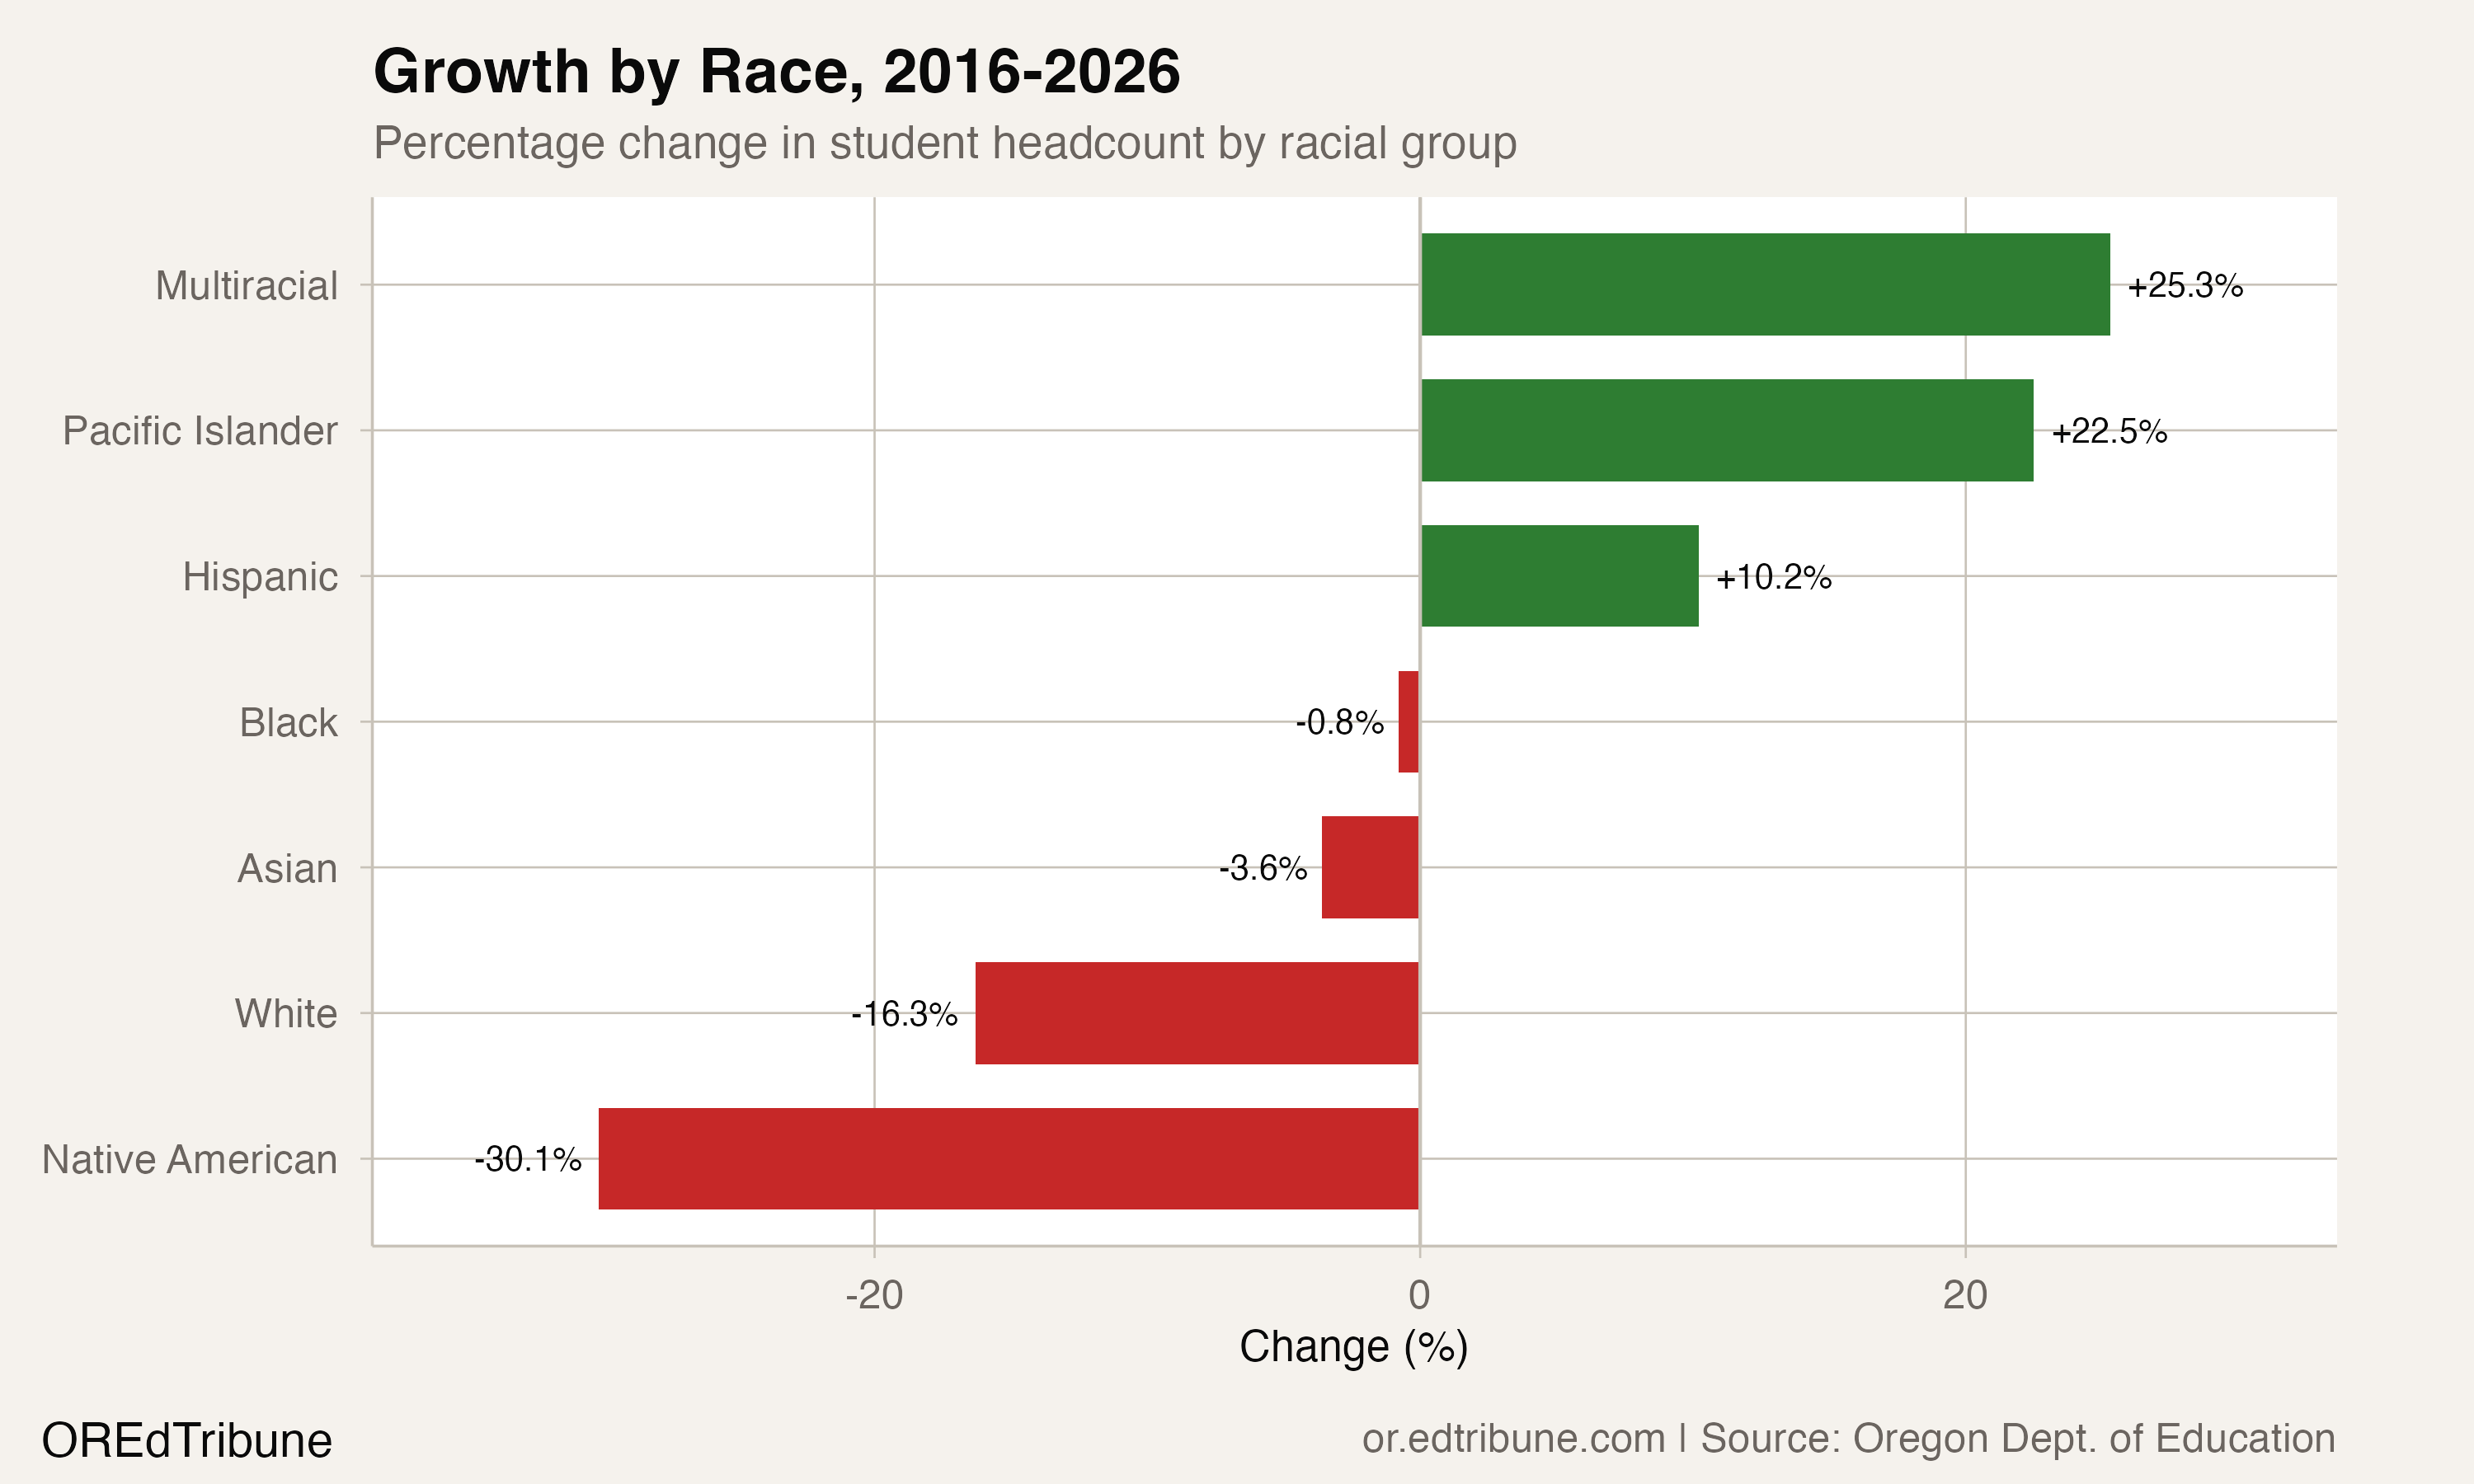
The other racial groups moved less. Asian enrollment dipped 3.6%, Black enrollment was essentially flat at -0.8% (-109 students), and Pacific Islander enrollment grew 22.5% but from a tiny base of 4,032. Native American enrollment fell 30.1%, a loss of 2,500 students that is the steepest proportional decline of any group.
Of 122 districts with at least 500 students, 95 saw multiracial enrollment grow over the decade and 26 saw it decline. The growth was broad but shallow in many places: the median district added a few dozen students. The concentration in Portland and its suburbs drives the statewide number.
What the plateau does not answer
The 2026 dip of 22 students is not statistically meaningful on its own. A single year cannot distinguish a plateau from a pause. If multiracial enrollment resumes growing at even a modest pace in 2027, the 2026 figure will be a footnote. If it stays flat or declines further, it will mark the end of a growth era that reshaped how Oregon counts its students.
The more consequential unknown is what happens when the OMB's revised race and ethnicity standards reach Oregon's enrollment forms. The combined question format could push multiracial identification higher, if families find it easier to select multiple categories on a single question, or lower, if the new "Middle Eastern or North African" category siphons off some respondents who previously selected multiple existing categories. No public reporting addresses this directly in Oregon.
For districts like Portland, where nearly one in eight students is multiracial, the practical question is whether this population's needs differ from any single-race group in ways that require specific attention. Multiracial students do not form a monolithic group. A student who is Black and white has a different experience from one who is Asian and Native American. The enrollment data captures neither distinction. It counts a checkbox.
Detailed code that reproduces the analysis and figures in this article is available exclusively to EdTribune subscribers.
Discussion
Sign in to join the discussion.
Loading comments...