In this series: Oregon 2025-26 Enrollment.
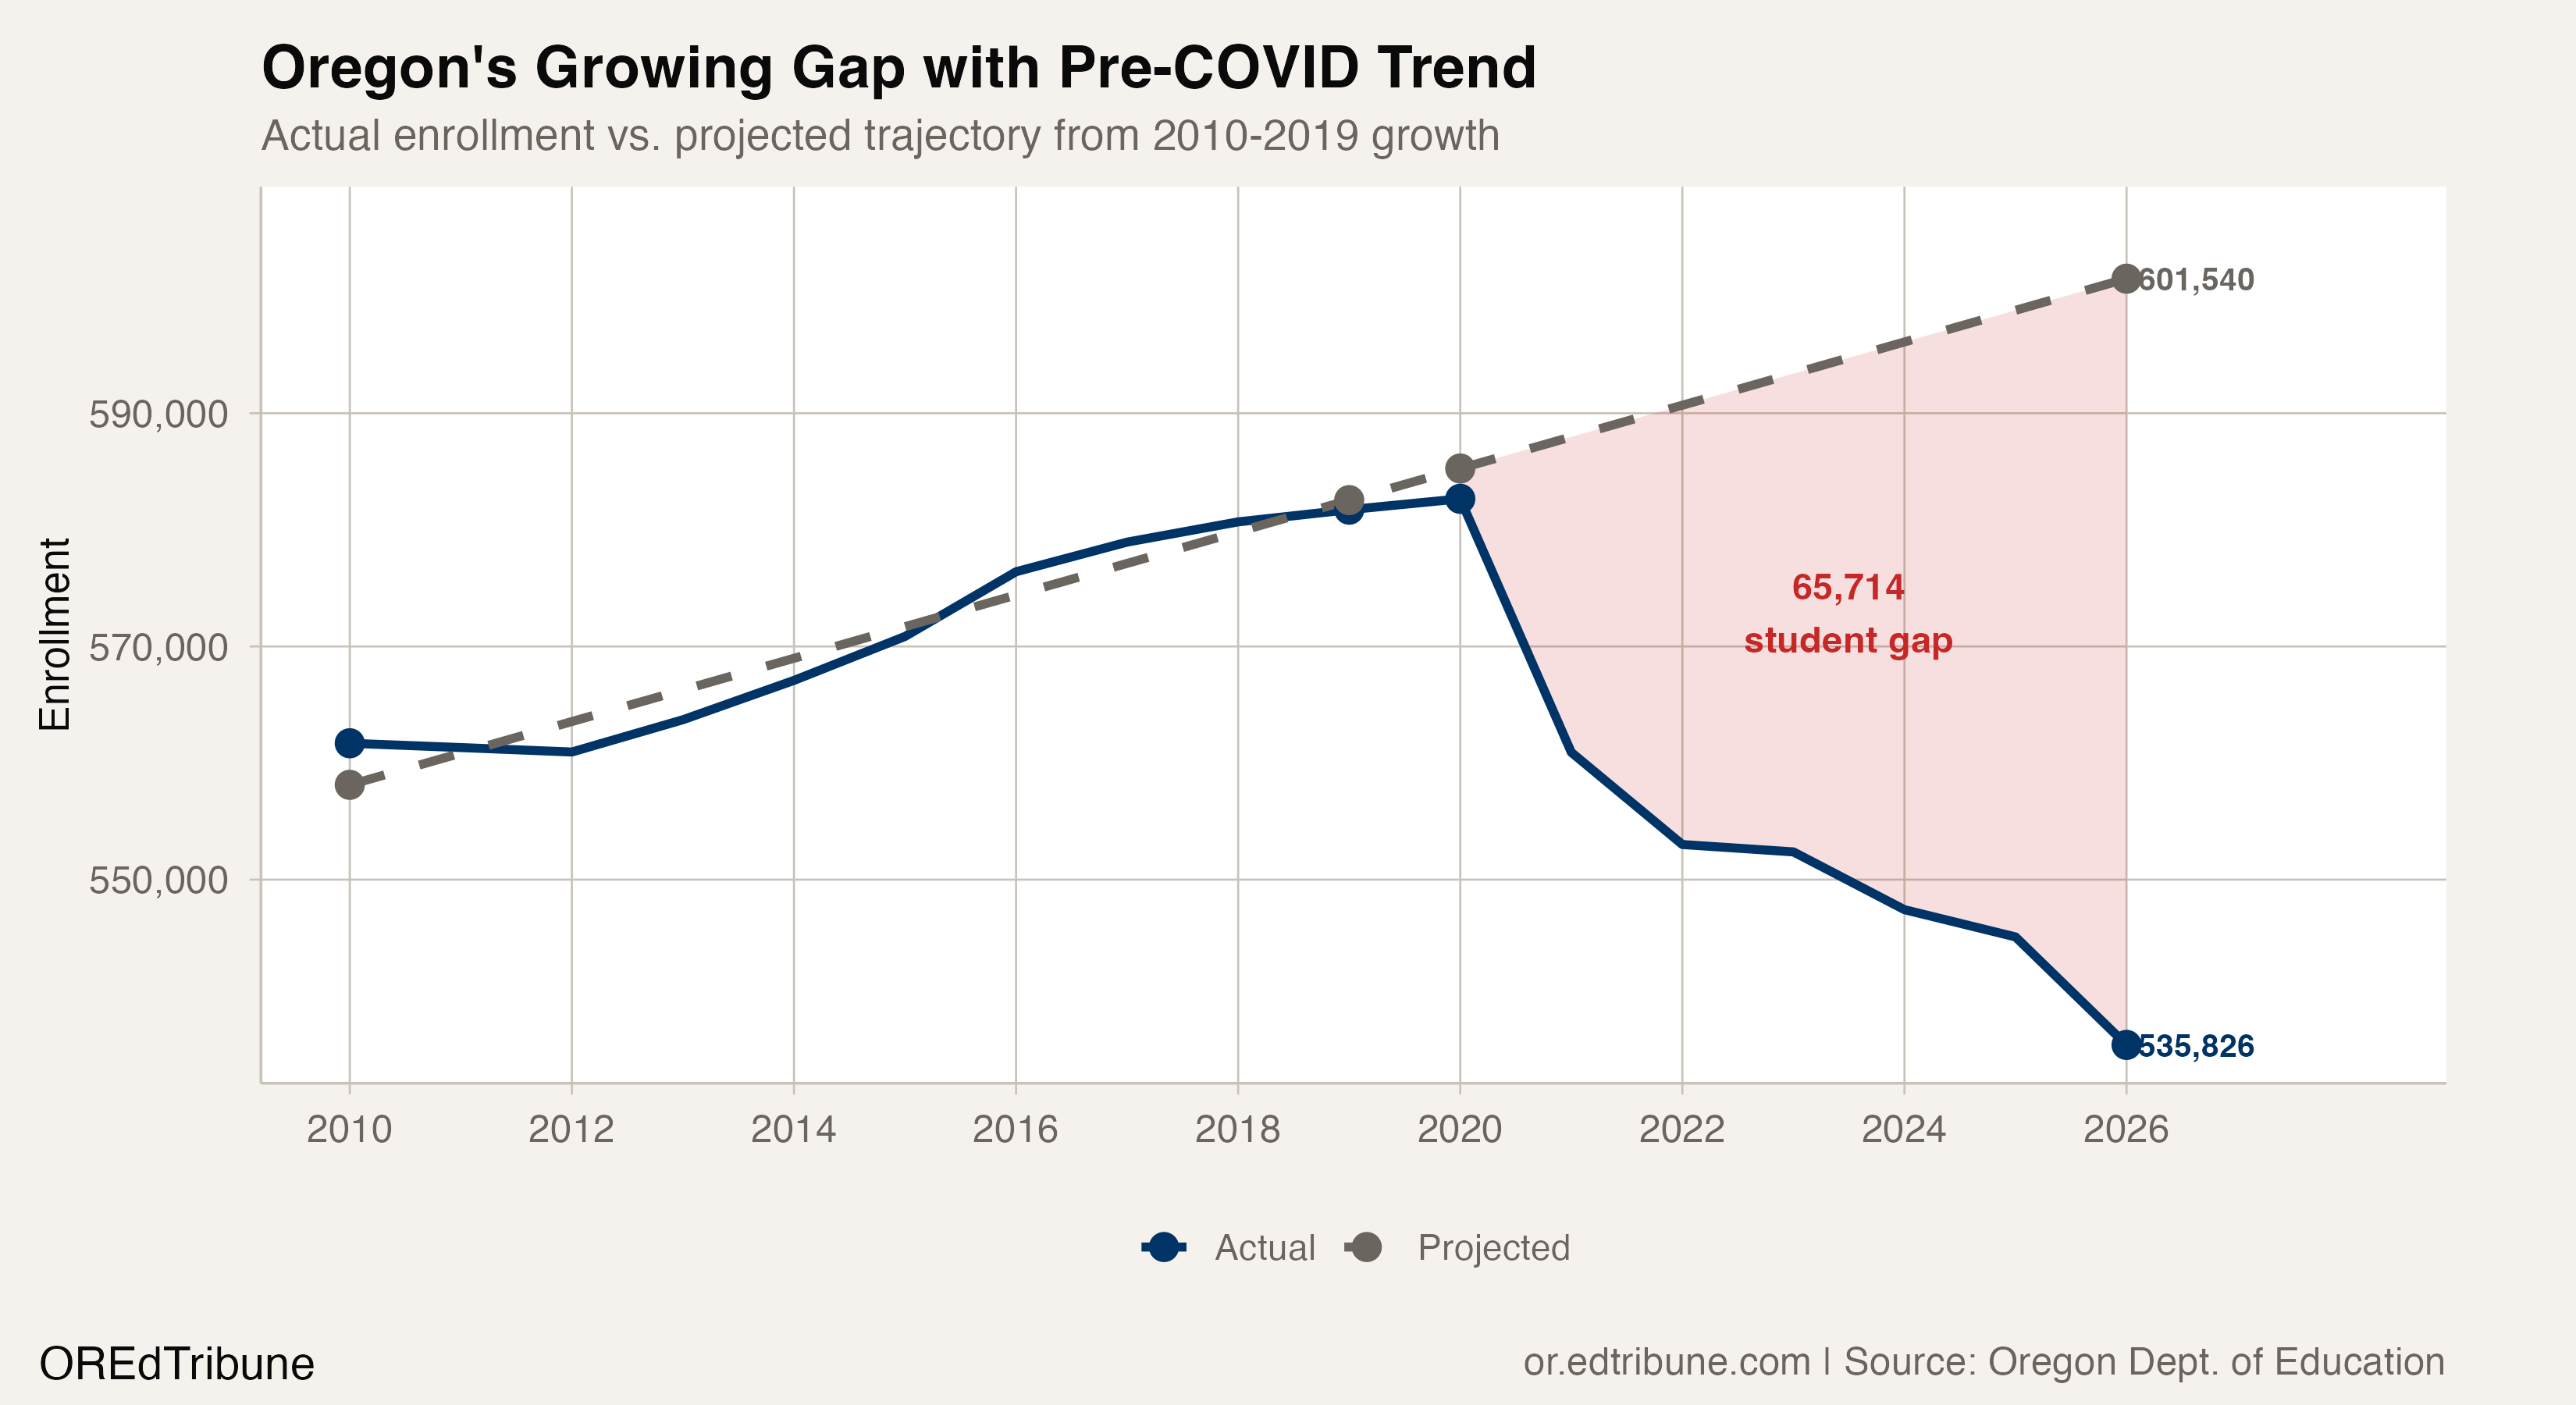
Before the pandemic, Oregon's public schools were growing. From 2013 through 2020, the state added 18,947 students, reaching a peak of 582,661. A linear projection of that pre-COVID trend would have put Oregon at 601,540 students by 2026.
Instead, the state enrolled 535,826. The 65,714-student gap between projection and reality is not only large; it is getting larger. In 2025, the gap stood at 53,739. Over the past year alone, it widened by 11,975 students, the fastest annual expansion since the initial pandemic crash of 2021.
This is no longer a recovery story. Oregon is not bouncing back slowly. It is pulling further away from where it was headed, and 2026 was the worst year since the pandemic itself.
Six years of divergence
The mechanics of the gap are worth parsing. In 2021, the COVID shock erased 21,744 students in a single year, the largest annual loss in Oregon's modern enrollment history. The state never recovered. Each subsequent year brought further decline: 7,905 in 2022, 632 in 2023, 4,956 in 2024, 2,336 in 2025.
Then 2026 delivered a 9,262-student loss, 1.7% of the prior year's enrollment. It was the second-largest single-year decline in the 17-year dataset, exceeded only by the pandemic year itself. It pushed Oregon to 535,826, an all-time low, below even the 2010 mark of 561,696 that preceded the decade of growth.
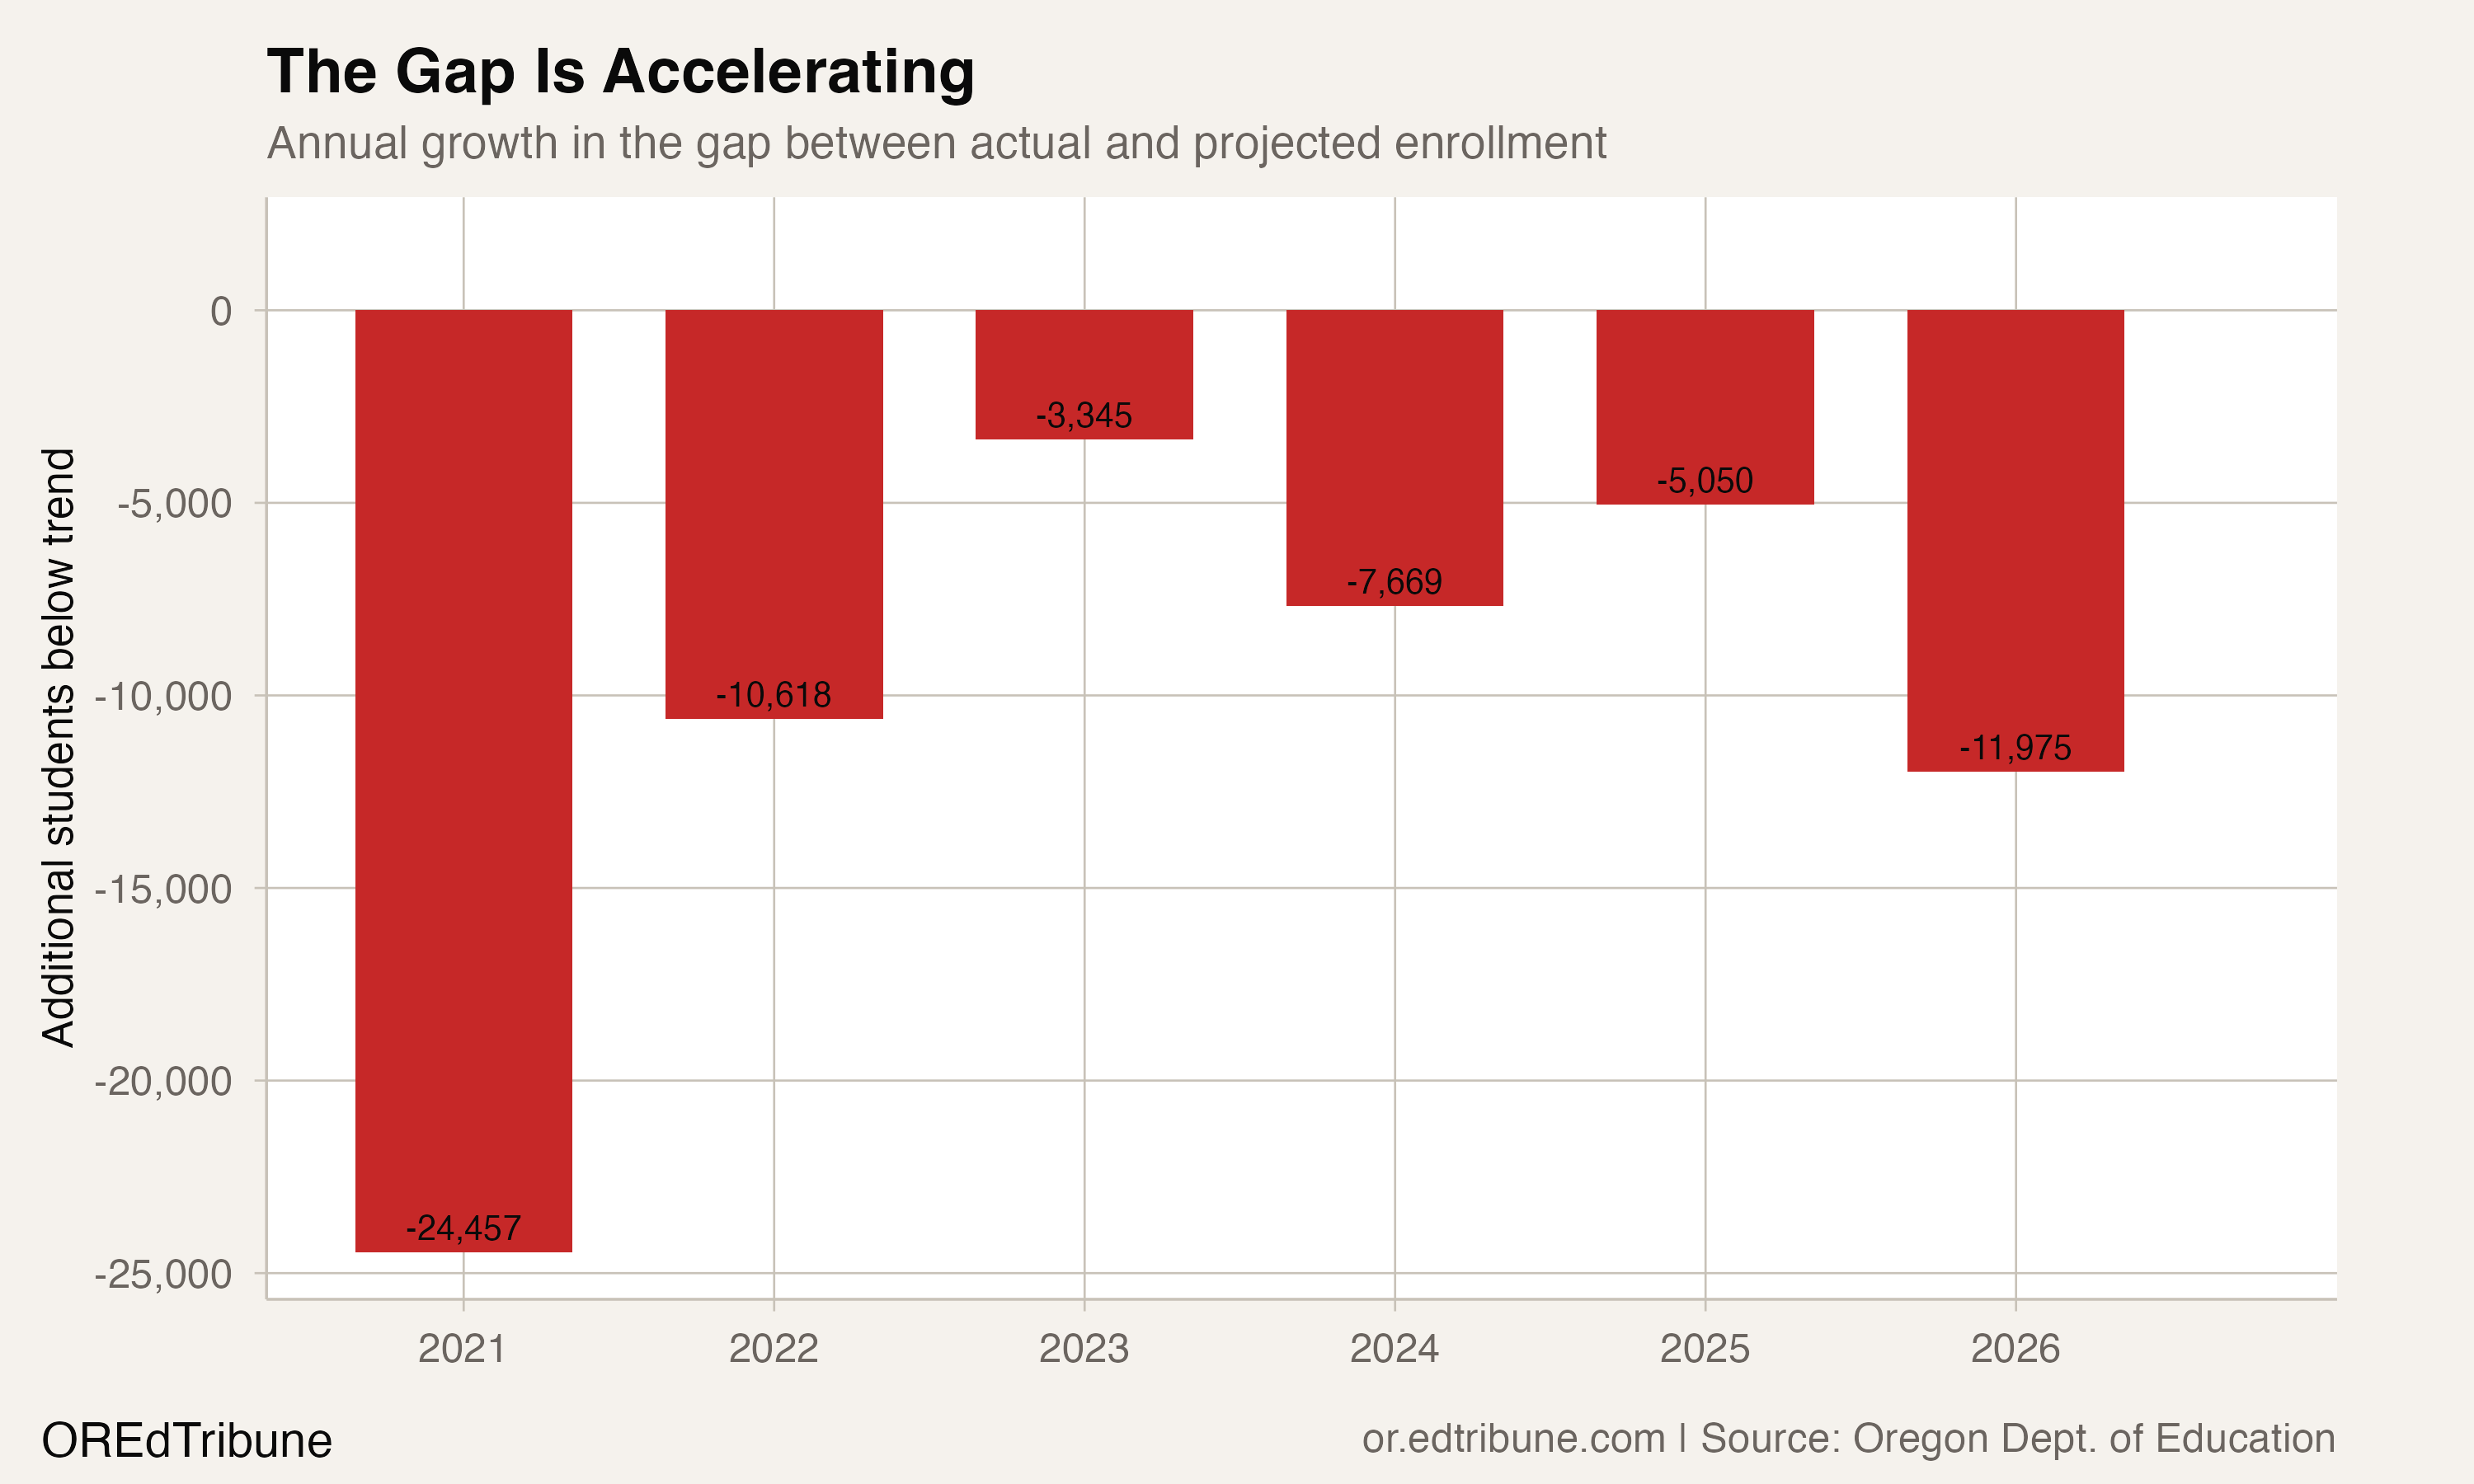
The pre-COVID trend line, built on 10 years of data from 2010 to 2019, had an R-squared of 0.94, meaning the growth was remarkably steady at roughly 2,713 students per year. That consistency makes the post-2020 divergence all the more striking. The gap did not stabilize after the initial shock. It grew by 10,618 in 2022, slowed to 3,345 in 2023, then reaccelerated to 7,669 in 2024, 5,050 in 2025, and 11,975 in 2026.
The losses are concentrated at the top
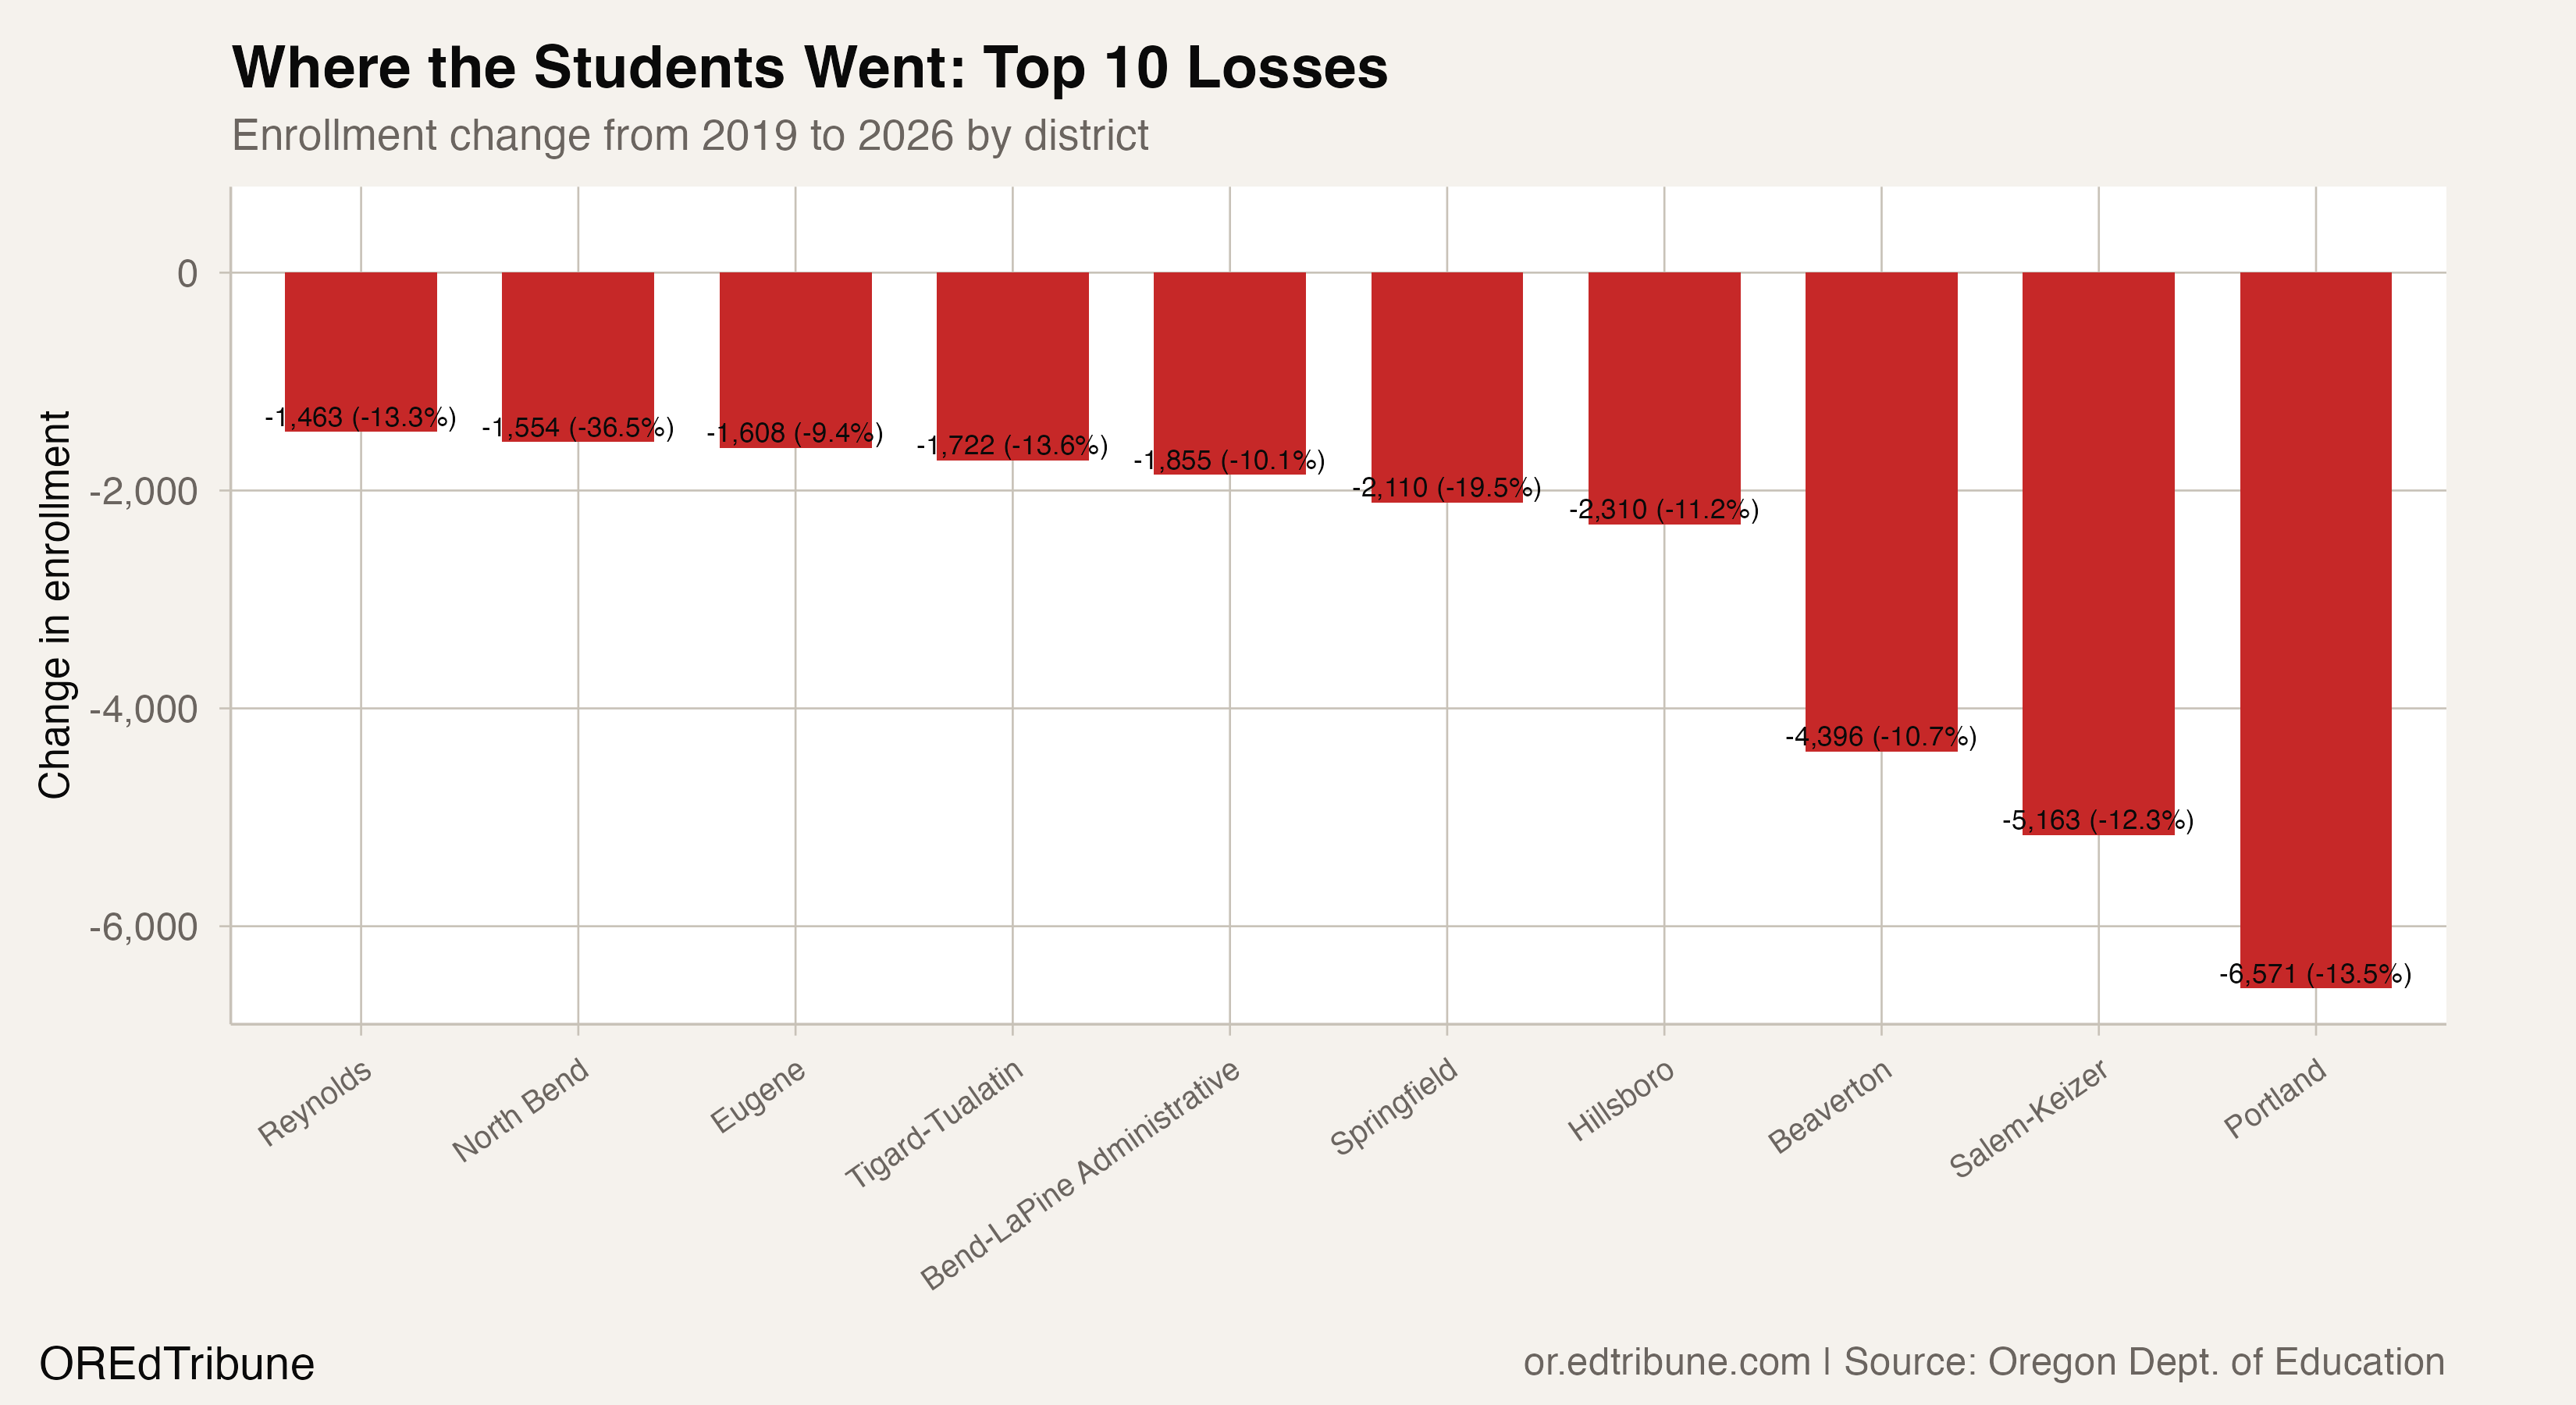
Portland, Salem-Keizer, and Beaverton alone account for 16,130 of the 45,904 students Oregon lost between 2019 and 2026, more than a third of the statewide total. All three are at all-time lows. Portland fell from 48,677 to 42,106 (down 13.5%), Salem-Keizer from 41,824 to 36,661 (down 12.3%), Beaverton from 40,964 to 36,568 (down 10.7%).
The pattern extends well beyond the big three. Seventy-four of Oregon's 209 districts, 35.4%, hit all-time enrollment lows in 2026. That list includes every major urban and suburban district: Hillsboro (down 2,310), Eugene (down 1,608), Bend-La Pine (down 1,855), Tigard-Tualatin (down 1,722). The top 10 losing districts account for 46.3% of all losses across districts that shrank.
Only 58 of 209 districts, 27.8%, have recovered to their 2019 enrollment levels. Many of the "gainers" are small rural districts that host statewide virtual charter schools, inflating their counts with students who live elsewhere.
Three forces, compounding
The most direct driver is demographic. Oregon has recorded more deaths than births for four consecutive years, with 3,850 more deaths than births in 2024 alone. The population of children aged 0-4 fell by 37,000 between 2020 and 2024, the largest decline of any age group. Oregon had the fifth-lowest birth rate in the nation in 2023 at nine births per 1,000 residents.
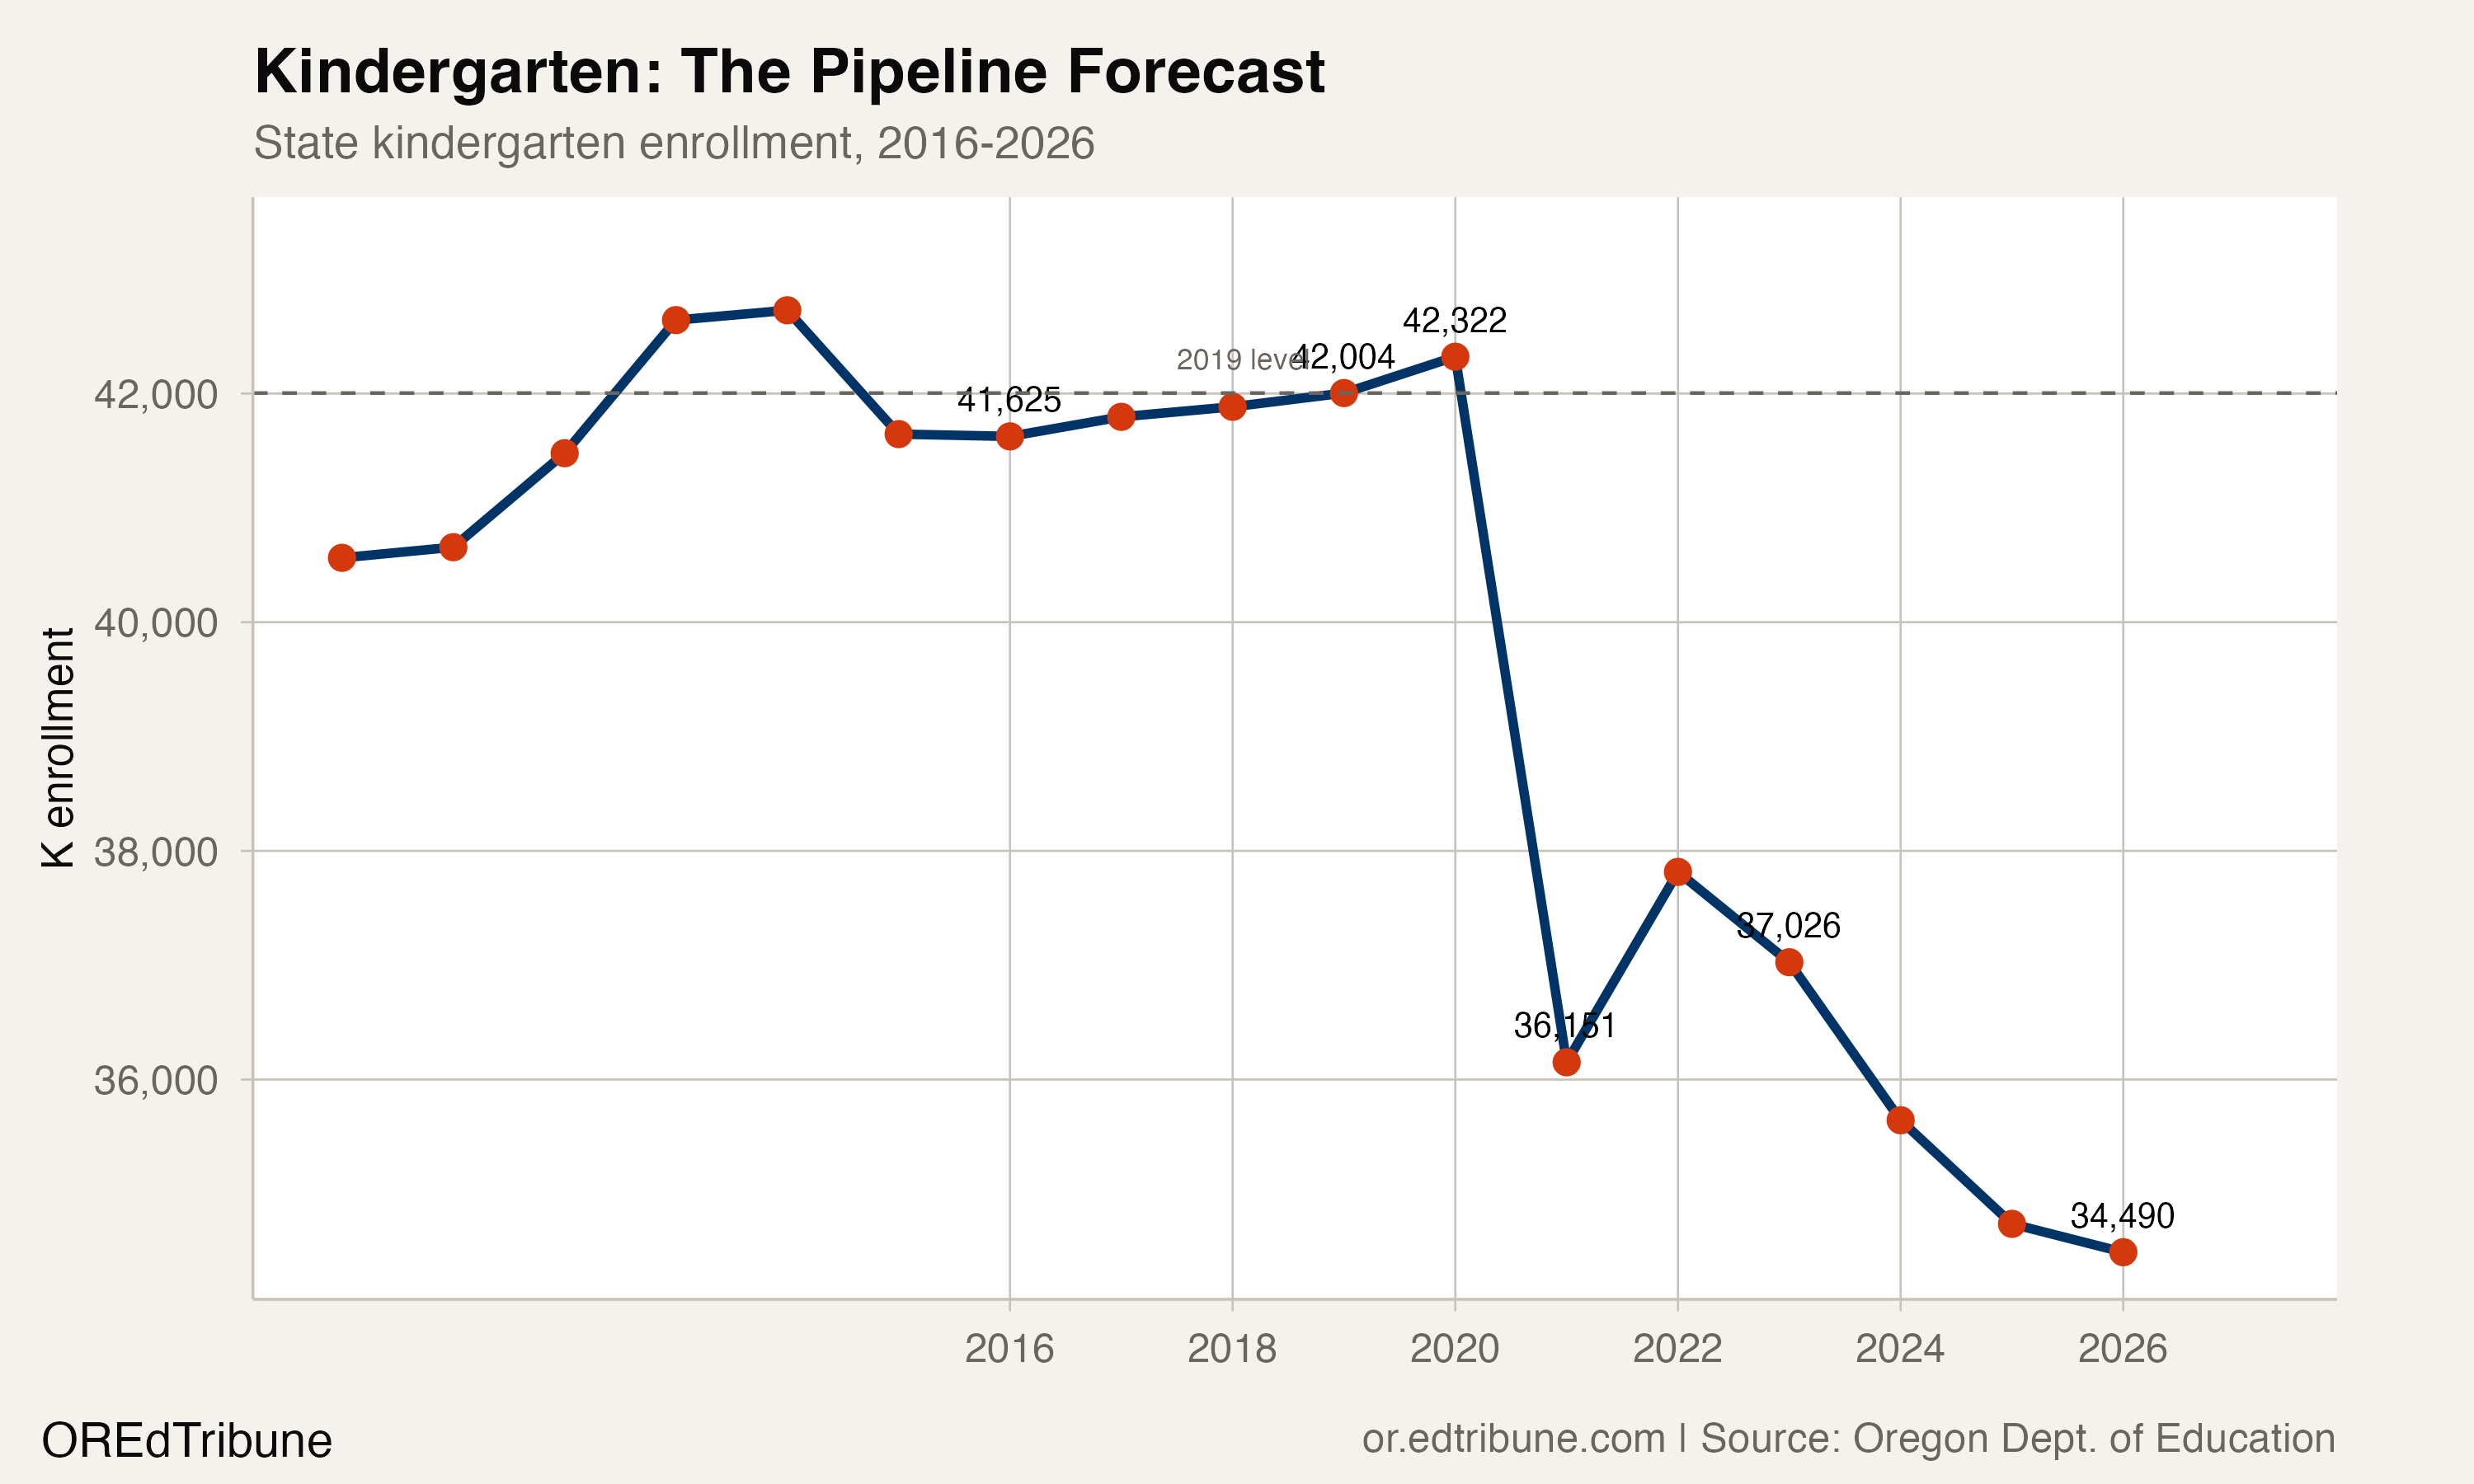
Kindergarten enrollment traces the birth rate with a five-year lag, and the signal is stark. Oregon enrolled 42,004 kindergarteners in 2019. In 2026, it enrolled 34,490, a 17.9% decline. The COVID year drove the initial drop, when K enrollment fell from 42,322 to 36,151, but the class never recovered and has continued sliding. Each of those smaller K cohorts will ripple upward through the grades for the next 12 years.
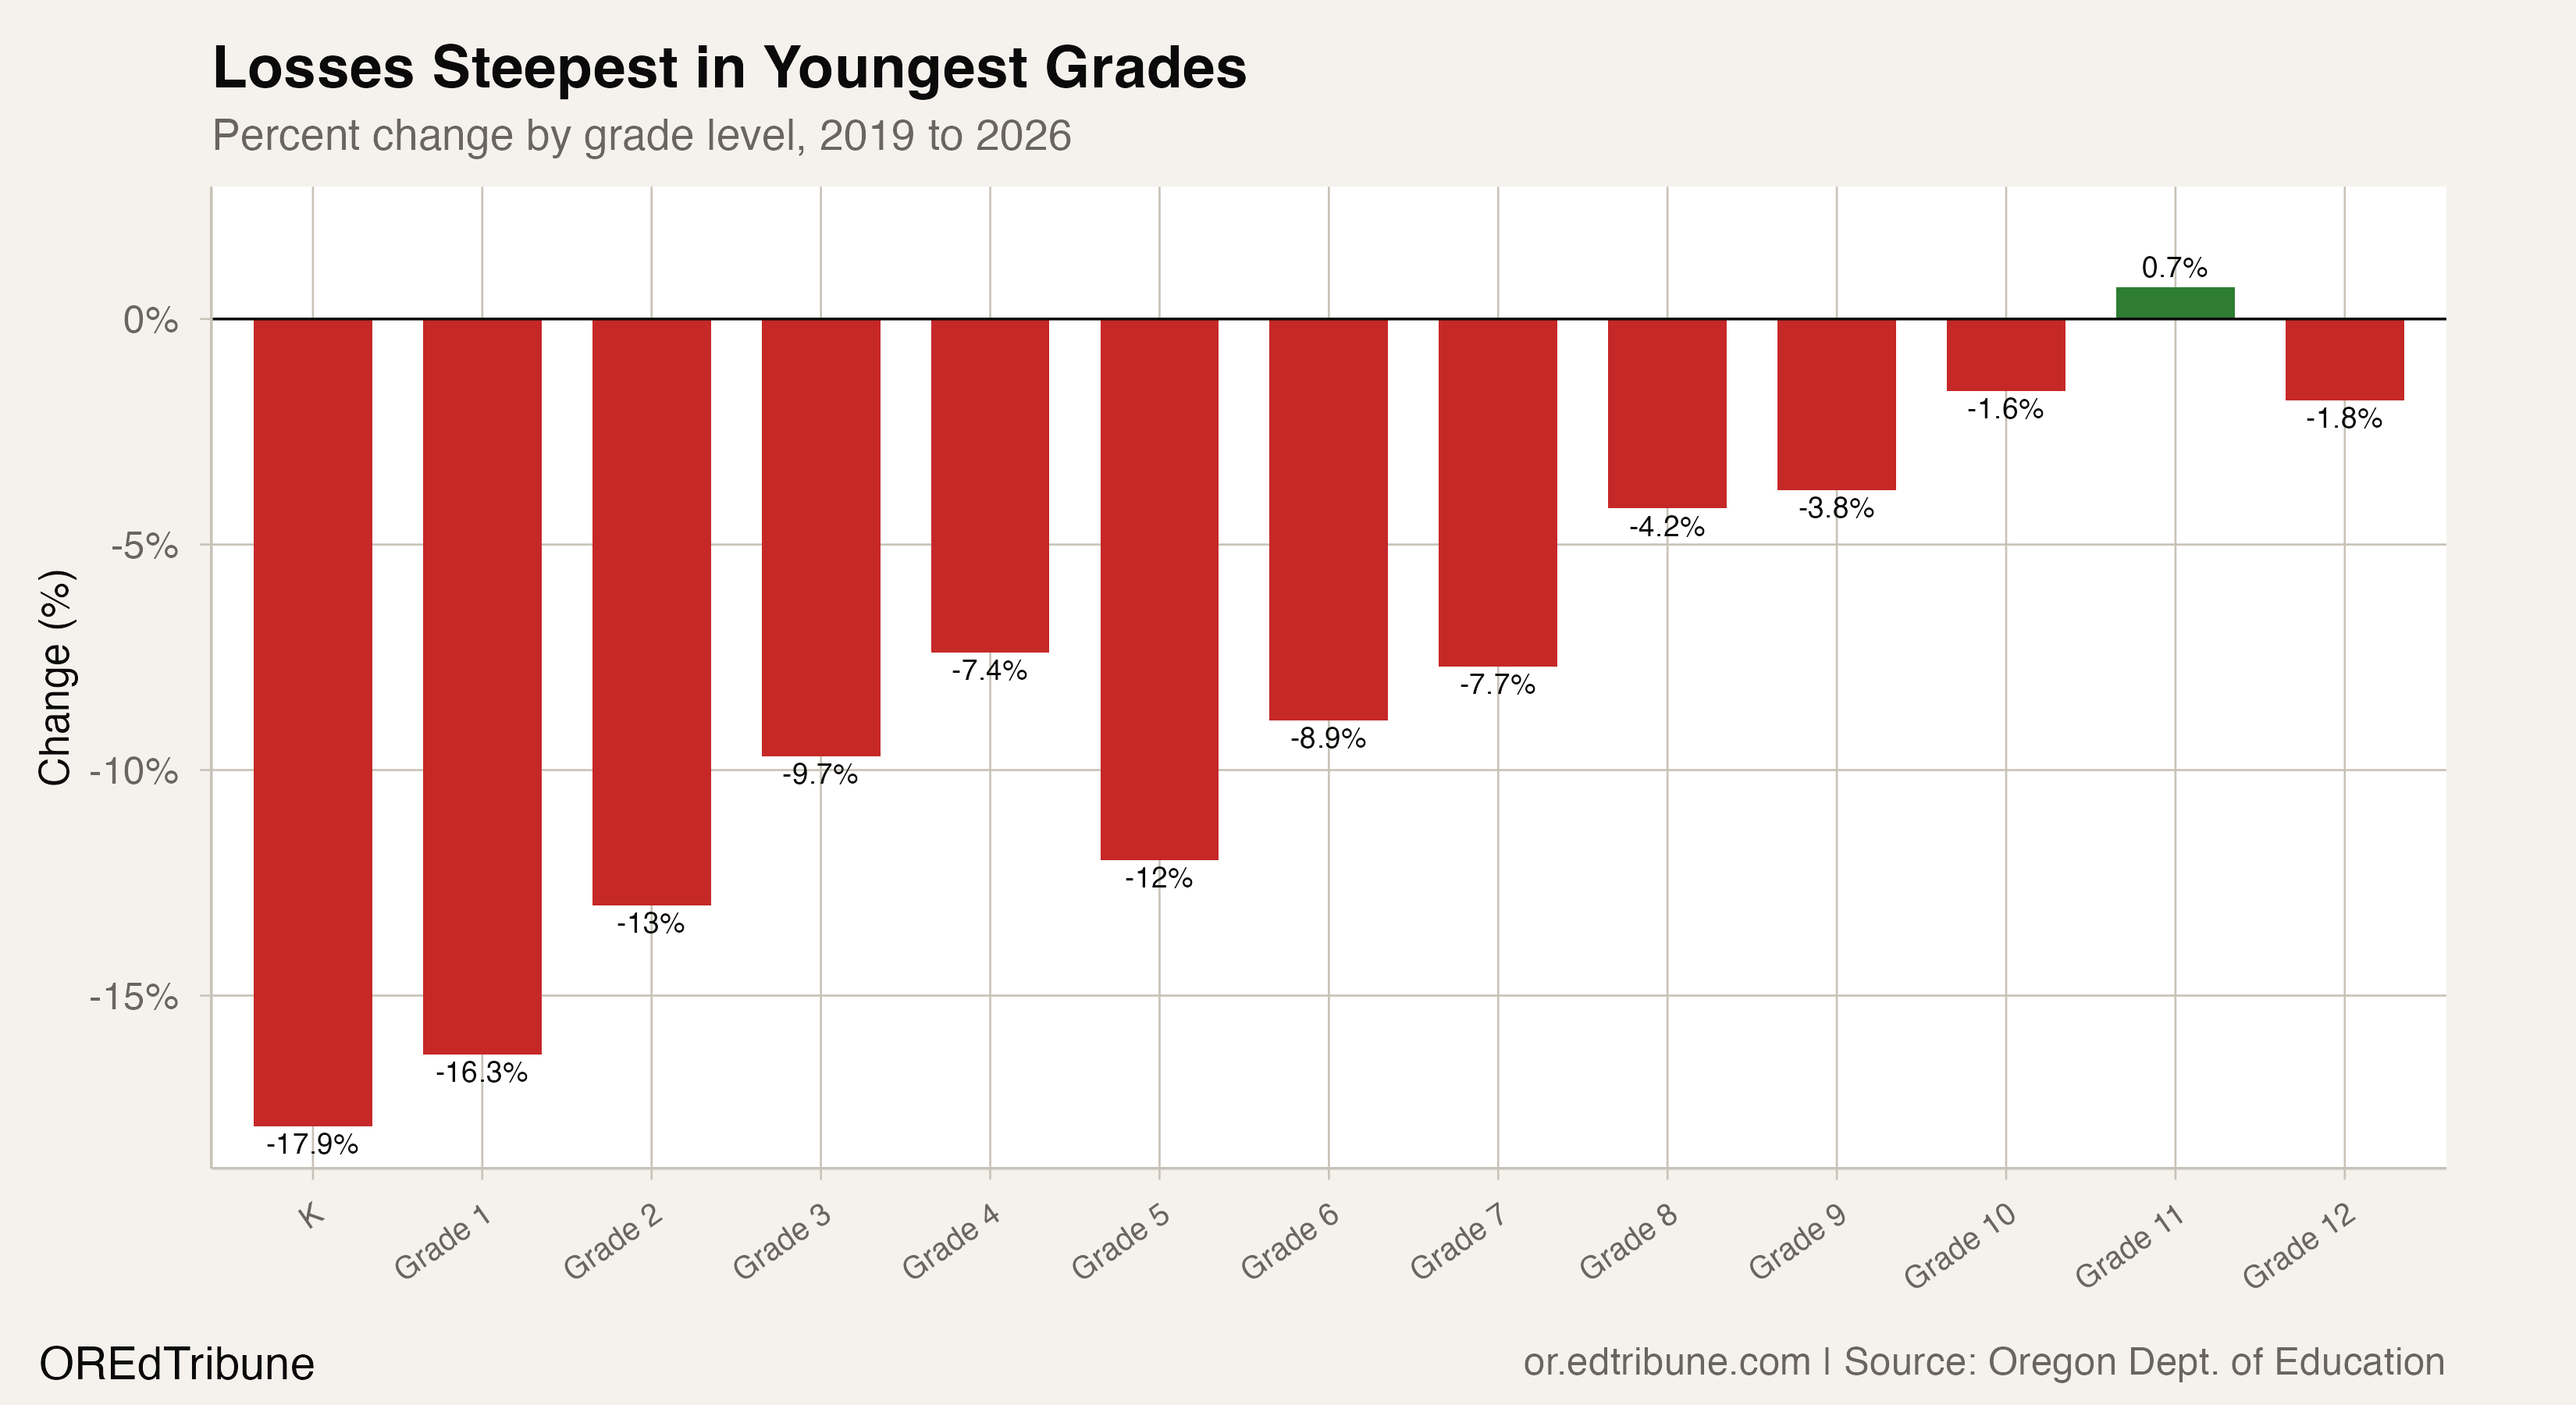
The grade-level data confirms the pipeline effect. Losses are steepest at the youngest grades: K is down 17.9%, first grade 16.3%, second grade 13.0%. By contrast, 10th grade is down just 1.6% and 11th grade actually grew 0.7%. The older cohorts reflect pre-pandemic birth rates; the younger ones reflect the new reality. As these smaller classes advance, the losses will compound year after year.
Migration is the second force. Between 2020 and 2025, net domestic migration resulted in a population loss of 670 for Oregon, a reversal from the in-migration that fueled the 2013-2020 enrollment growth. International immigration has kept Oregon's total population roughly flat, adding 56,700 residents over the same period. But international arrivals skew toward working-age adults, not school-age children, limiting the offset to enrollment.
The third force is attrition from the public school system. A Brookings Institution analysis found that 12% of Oregon's school-age children are "unaccounted for," enrolled in neither public schools, private schools, nor registered homeschool programs. Homeschooling surged 72% during the first two years of the pandemic, and not all of those families returned.
"We do not see the increase in the share of school-aged children not attending public schools to be fully explained by a corresponding bump in private school enrollment." -- OPB, Nov. 2025, citing Sofoklis Goulas, Yale University
Budget math no one wants to do
Oregon funds schools through a per-pupil formula, so every lost student removes revenue from a district's operating budget. The consequences are already material. Portland faces a $40 million shortfall for 2025-26 and has signaled that school closures are possible in the near future. Eugene 4J is cutting $30 million and eliminating three of four assistant superintendent positions. Reynolds plans to cut over 100 educators.
"Our schools are not only charged with providing education to students but serve as triage centers for all the ways our society fails to support people." -- OPB, May 2025, quoting Jeffrey Fuller, Reynolds Education Association president
Georgetown University's Edunomics Lab has noted that federal COVID relief funds masked the enrollment decline for several years, padding budgets even as headcounts fell. Those funds have now expired. The 2025 Legislature passed a record $11.4 billion K-12 budget for 2025-27, an 11% increase over the prior biennium. But per-pupil funding and absolute funding are different things. Districts losing students faster than the state average are losing their share of the pie even as the pie grows.
What the trajectory does not capture
A linear projection is a blunt tool. It assumes growth would have continued at 2,713 students per year indefinitely, which is unlikely. Birth rates were already declining before the pandemic, and the pre-COVID growth was decelerating: from 5,550 new students in 2016 to just 931 in 2020. Some version of a slowdown was coming regardless.
But the gap between "slowdown" and "collapse" is vast. Even a conservative scenario, one where growth merely flattened to zero after 2020, would have left Oregon at 582,661 students in 2026 rather than 535,826. The pandemic did not create a temporary dip. It marked a permanent downward inflection, accelerated by demographic forces that show no sign of reversing.
The WICHE "Knocking at the College Door" report projects a 19% decline in Oregon high school graduates by 2041, far steeper than the national average of 13% and more than double Washington's projected 8% decline. The kindergarten numbers in the enrollment data are consistent with that trajectory. Oregon's 34,490 kindergarteners in 2026, compared to 45,848 12th graders, suggest the state will be graduating roughly 11,000 more students per year than it enrolls for at least the next decade.
Eugene 4J eliminated three of its four assistant superintendent positions in 2025-26. Reynolds is considering cutting 10 instructional days from the school calendar. Portland has signaled that school closures are coming. These are not hypothetical responses to a projected decline. They are the operational reality of a gap that grew by 12,000 students in a single year and shows no sign of narrowing.
Detailed code that reproduces the analysis and figures in this article is available exclusively to EdTribune subscribers.
Discussion
Sign in to join the discussion.
Loading comments...