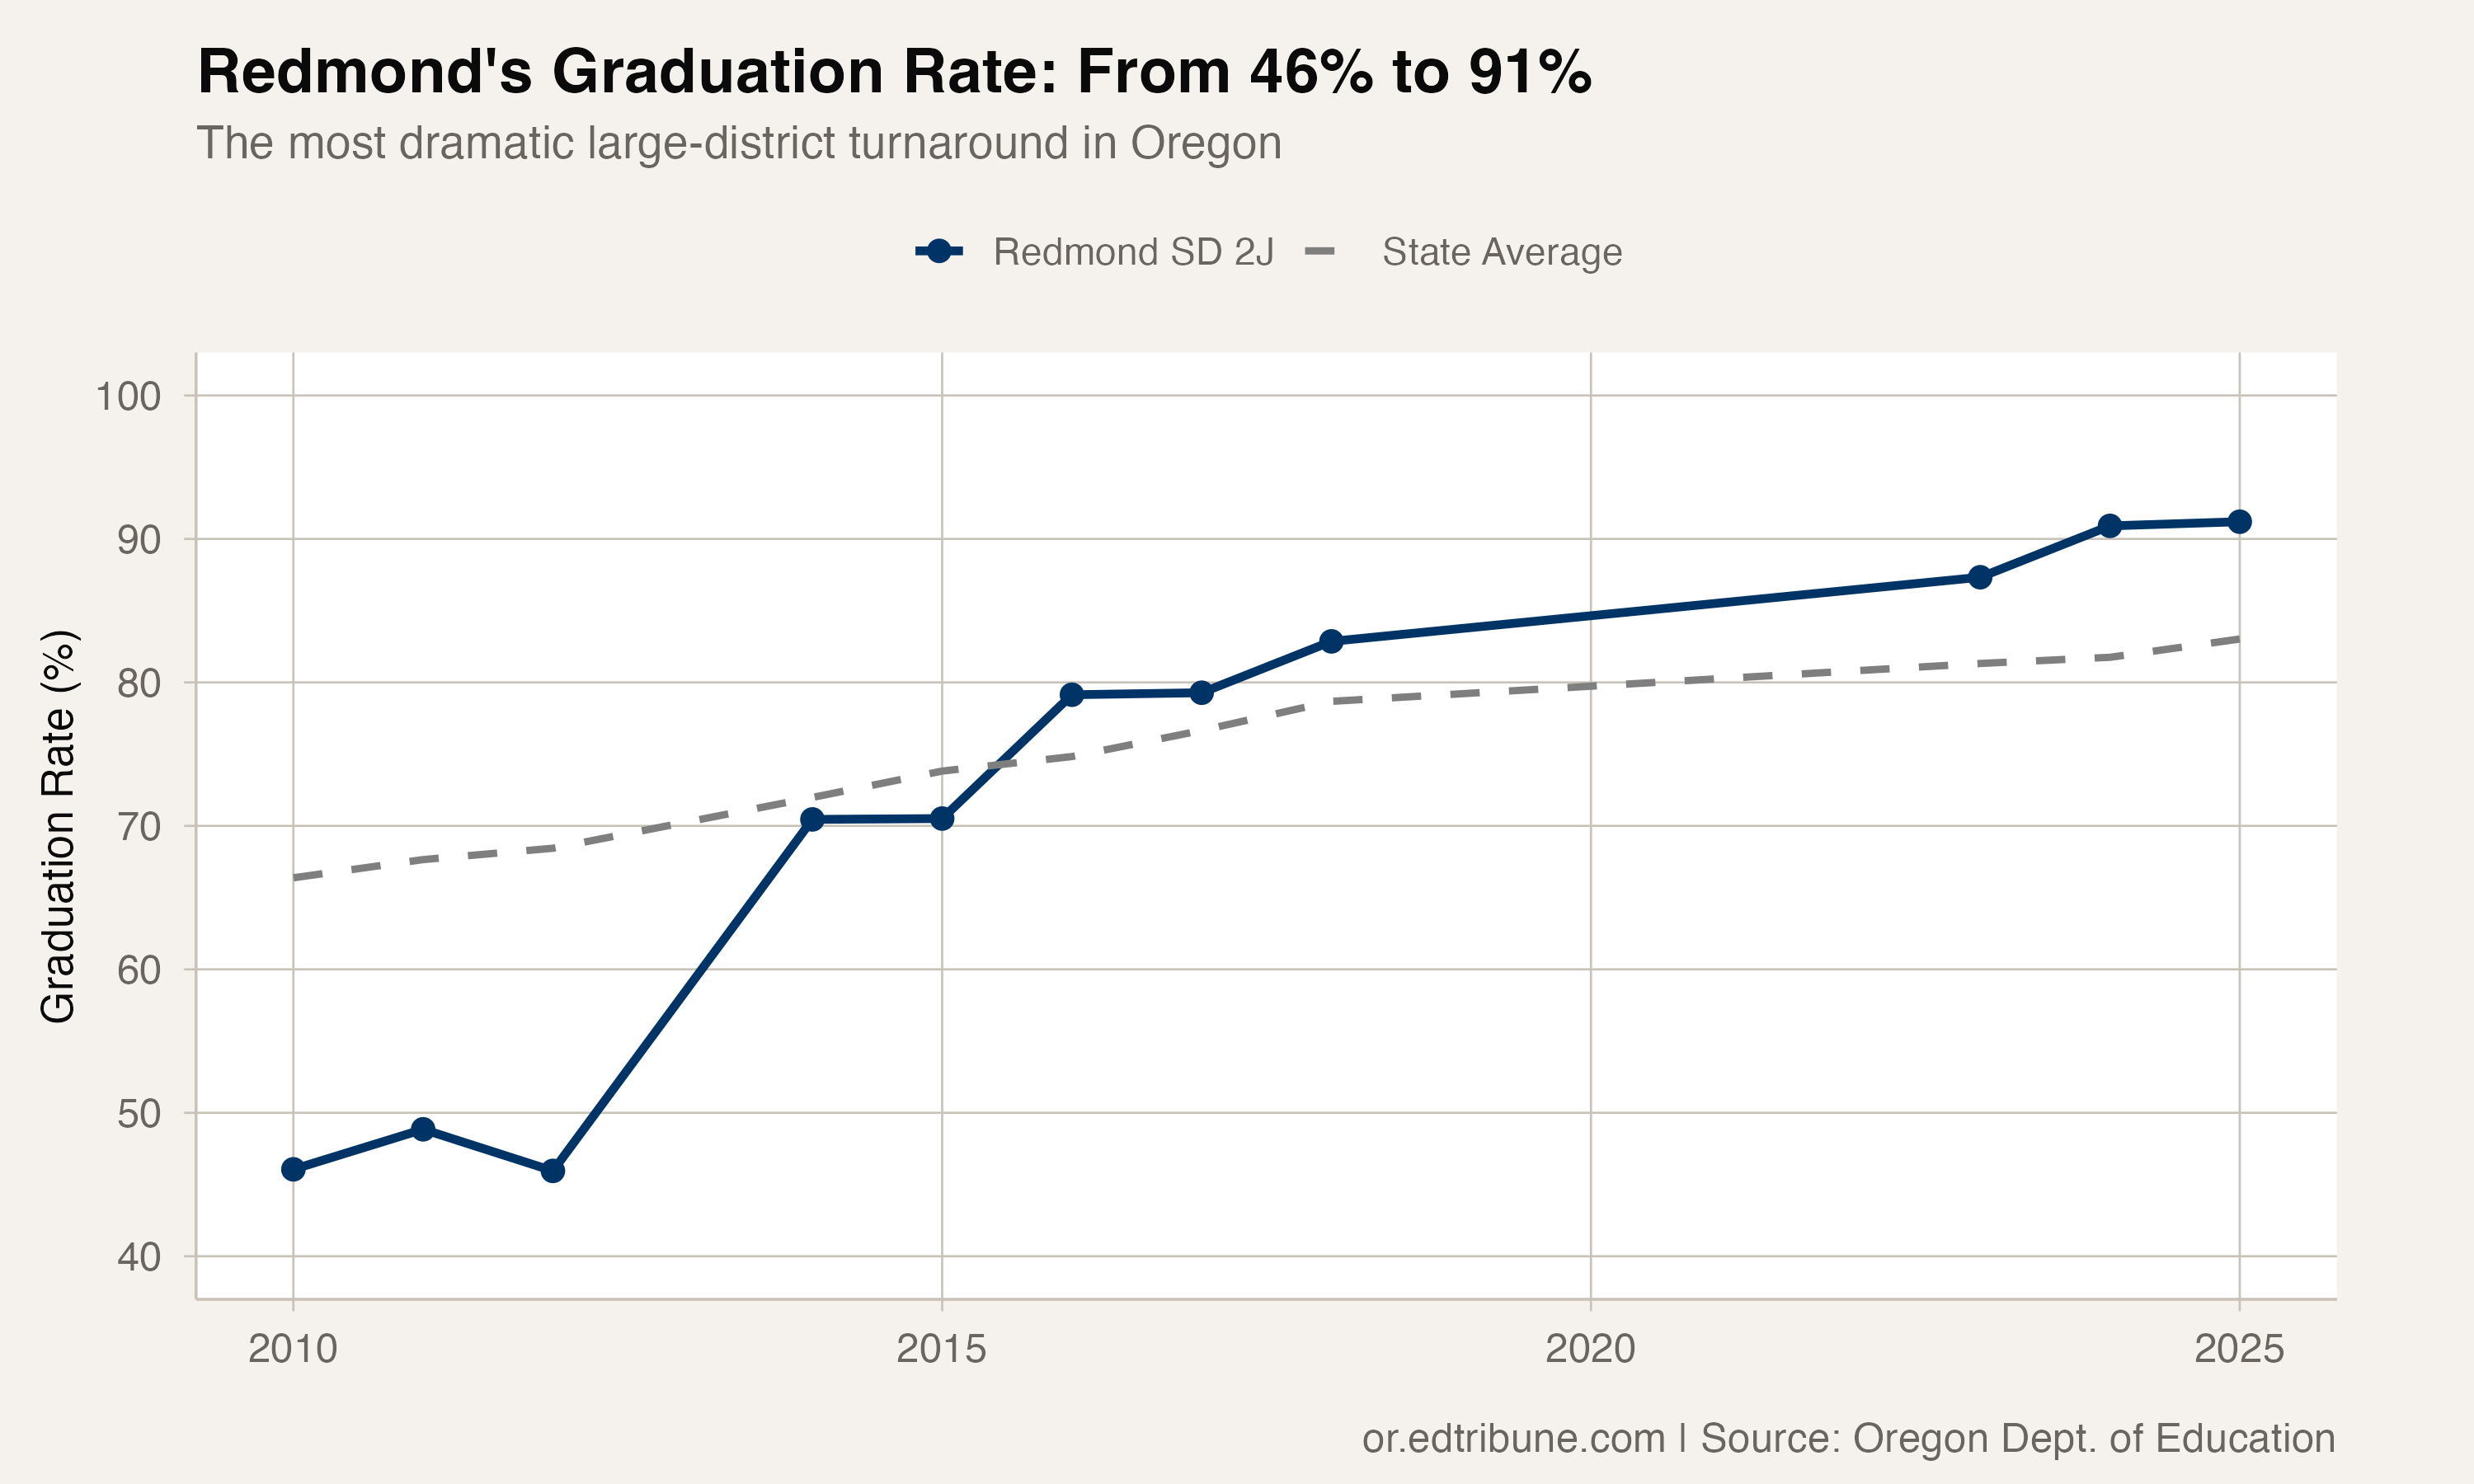
A decade and a half ago, Redmond SD 2J↗ET was a cautionary tale. In 2010, just 46.1% of its students graduated on time, 20 points below the state average, in a district with more than 500 students per graduating class. In Central Oregon parlance, Redmond was a crisis.
The Class of 2025 graduated at 91.2%.
That 45.1 percentage point improvement, from below-50% to above-90%, is the largest gain among Oregon districts with 500 or more students. And with 683 students in the graduating cohort, this is not a small-school statistical artifact.
The Shape of the Turnaround
Redmond's improvement came in two phases. The first was a leap: from 46.1% in 2010 to 70.4% in 2014, a 24-point jump in four years (with 2013 data unavailable). The second was a sustained climb: 70.4% to 91.2% over the next eleven years, adding roughly 2 points annually.
| Year | Redmond | State Average | Difference |
|---|---|---|---|
| 2010 | 46.1% | 66.4% | -20.3 |
| 2012 | 46.0% | 68.4% | -22.5 |
| 2014 | 70.4% | 72.0% | -1.5 |
| 2016 | 79.1% | 74.8% | +4.3 |
| 2018 | 82.9% | 78.7% | +4.2 |
| 2023 | 87.3% | 81.3% | +6.0 |
| 2025 | 91.2% | 83.0% | +8.2 |
Redmond crossed the state average around 2015 and has been pulling further ahead ever since. The district now graduates at 8.2 points above the statewide rate.
Not Just the Headline Number
The turnaround extends across Redmond's student body. Hispanic students graduated at 84.6% in 2025, special education students at 79.3%, and economically disadvantaged students at 85.6%. Only English learners lag significantly at 70.3%, though with a small cohort of 37 students.
White students lead at 93.0%, but the gap between Redmond's white and Hispanic students (8.4 points) is wider than the statewide gap of 4.6 points, though both groups in Redmond outperform their statewide averages.
Why the Scale Matters
Oregon has other districts with large graduation rate gains. But Redmond's combination of depth (45 points), duration (improvement in every year since 2012), and scale (600+ student cohorts throughout) is unmatched. The district was not starting from a high baseline with a small bump. Fewer than half its students finished high school in 2010, and it rebuilt from there.
The improvement also survived the COVID reporting gap. When data resumed in 2023, Redmond emerged at 87.3%, well above its pre-gap trajectory, suggesting the district maintained its momentum even during disrupted years.
Central Oregon's Quiet Story
Redmond sits in Deschutes County, about 15 miles north of Bend, in one of Oregon's fastest-growing regions. The district has absorbed population growth while simultaneously improving outcomes. Most school systems struggle to manage that combination.
The turnaround has not attracted the national attention that similar transformations receive in larger cities. But in a state where 15 districts still graduate fewer than 70% of their students, Redmond's path from 46% to 91% offers evidence that 45-point improvement is possible in mid-size districts without extraordinary funding or structural overhauls.
Data Source
This analysis uses four-year adjusted cohort graduation rate data published by the Oregon Department of Education, covering the Classes of 2010 through 2025 (excluding 2013 and 2019-2022, years when comparable data was not published).
Detailed code that reproduces the analysis and figures in this article is available exclusively to EdTribune subscribers.
Discussion
Sign in to join the discussion.
Loading comments...