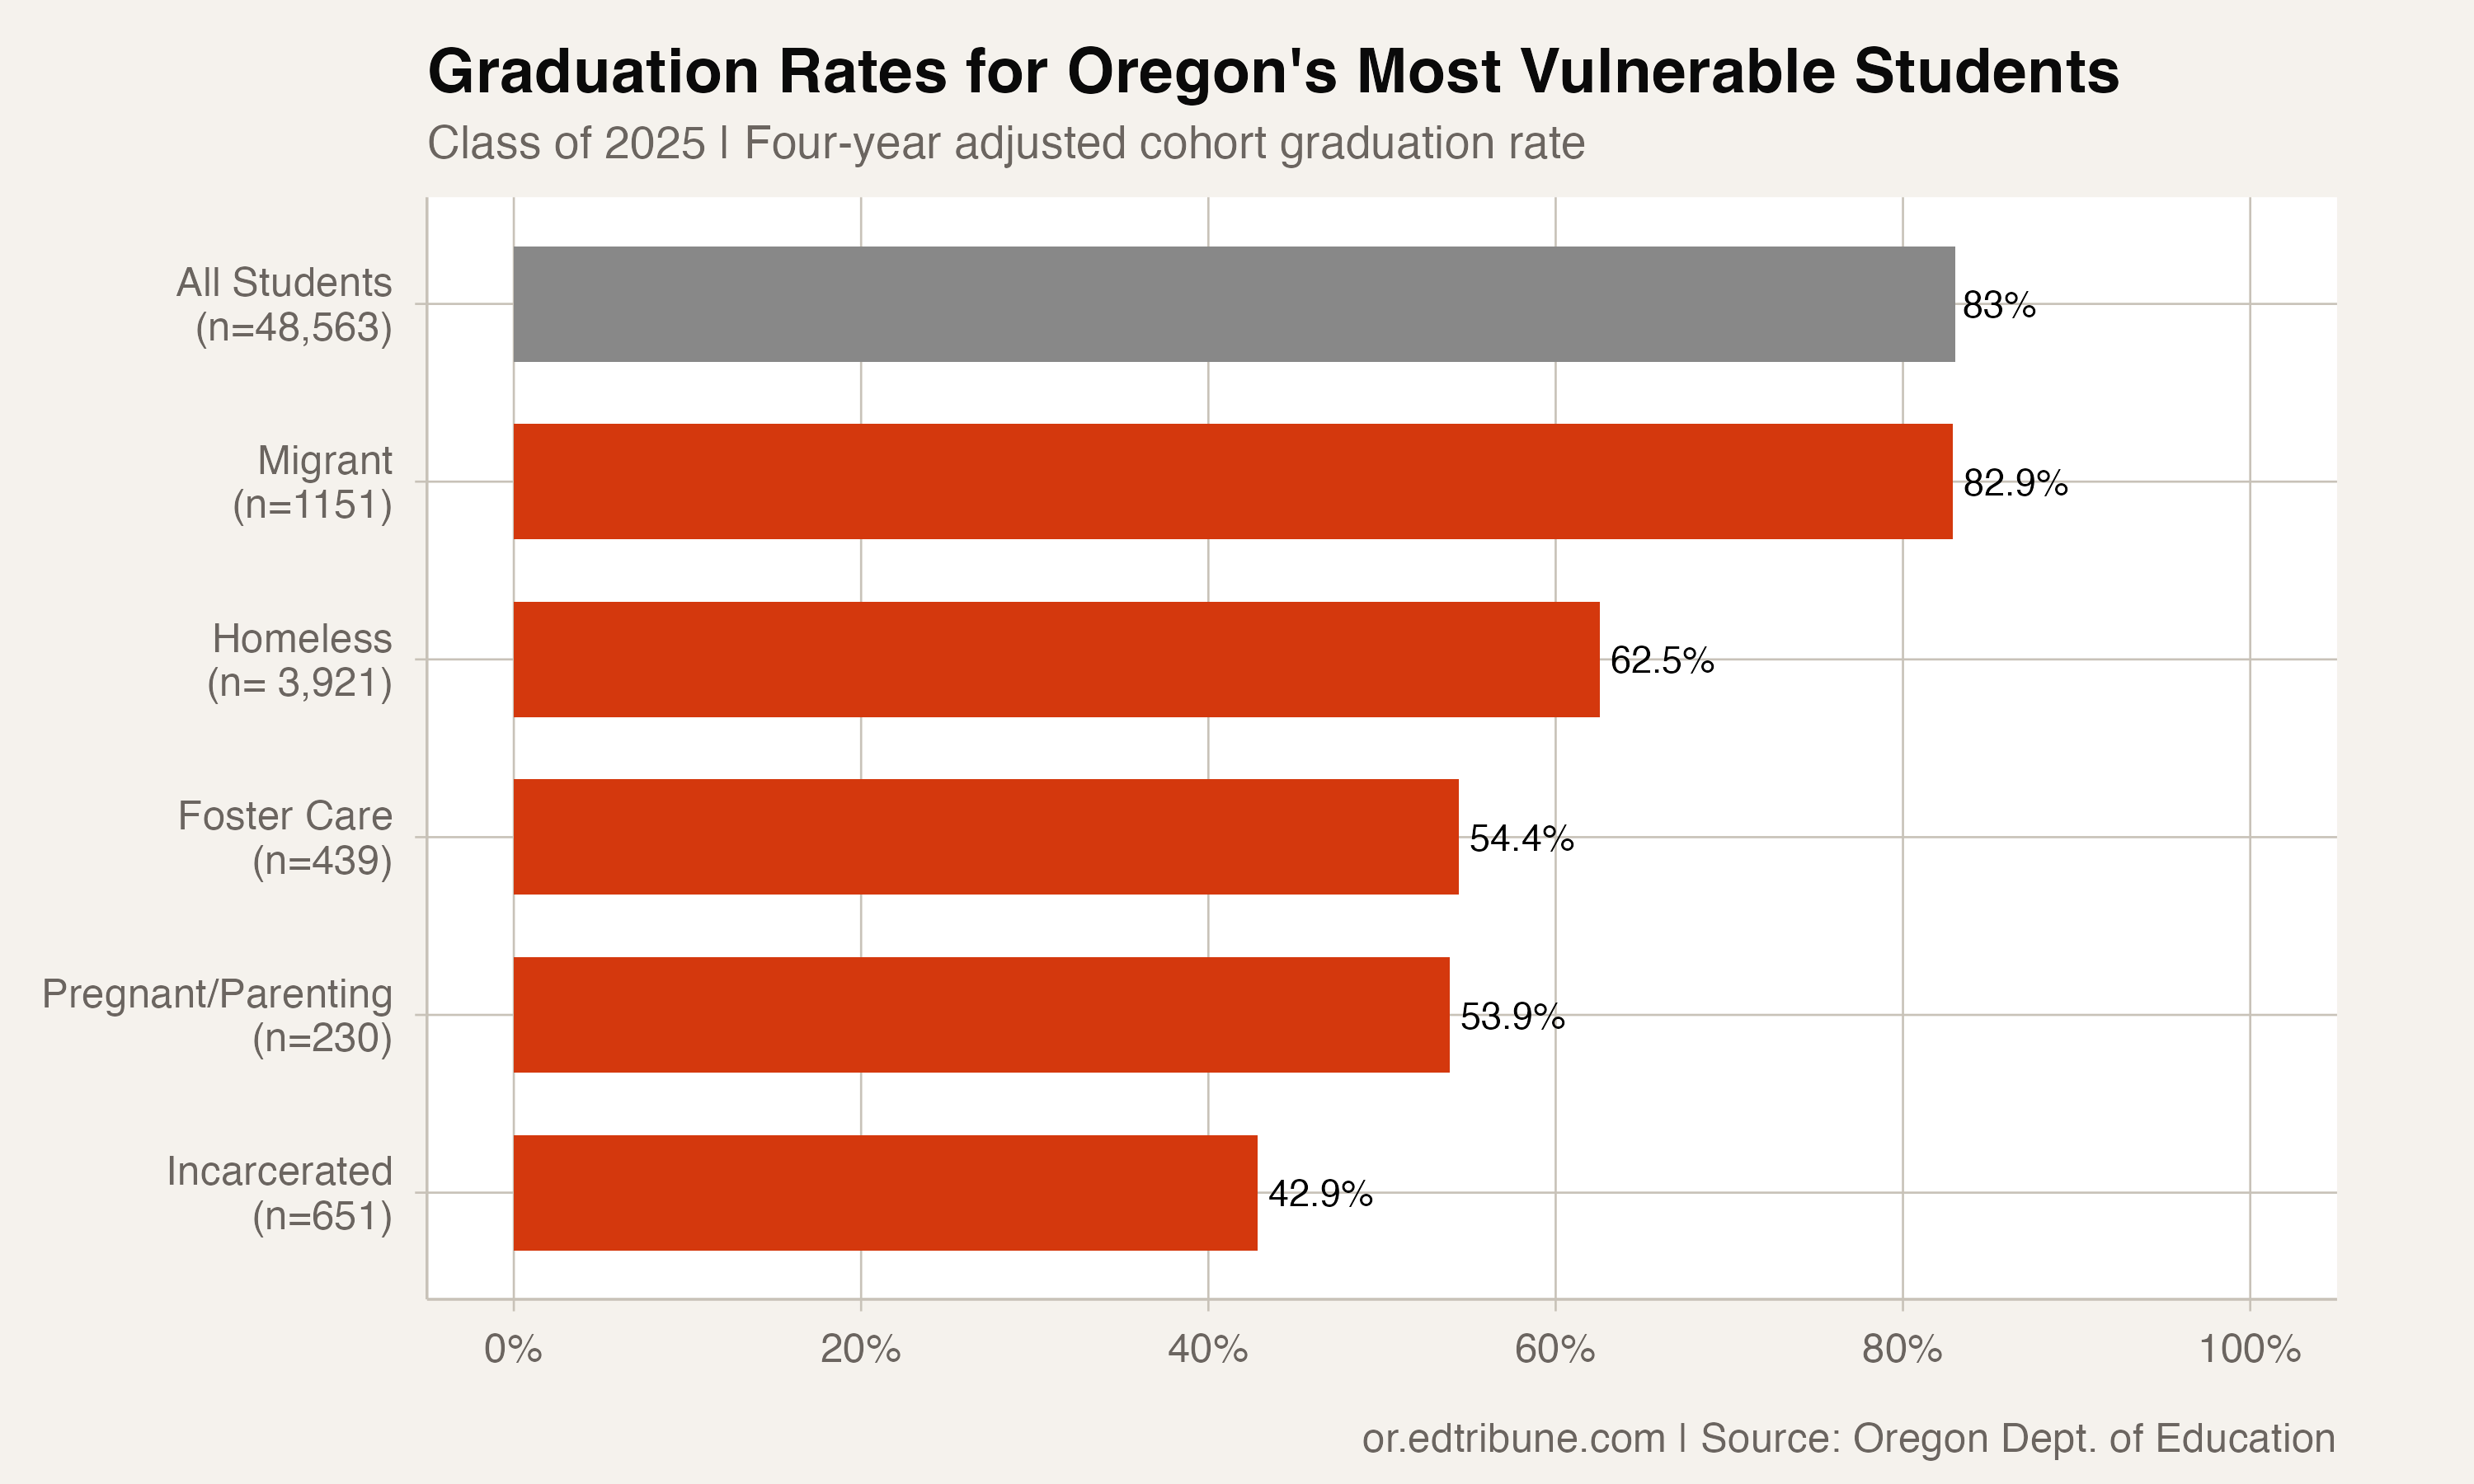
For the Class of 2025, Oregon reported a 54.4% graduation rate for students in foster care, 62.5% for students experiencing homelessness, 42.9% for incarcerated students, and 53.9% for students who were pregnant or parenting.
The statewide average was 83.0%.
The numbers behind the percentages
Oregon's statewide cohort included 48,563 students. The reported subgroup cohorts included 3,921 students experiencing homelessness, 439 students in foster care, 651 incarcerated students, and 230 students who were pregnant or parenting.
The state also reported an 82.9% rate among 1,151 migrant students and an 86.9% rate among 435 military-connected students. The latter was 3.9 points above the statewide rate.
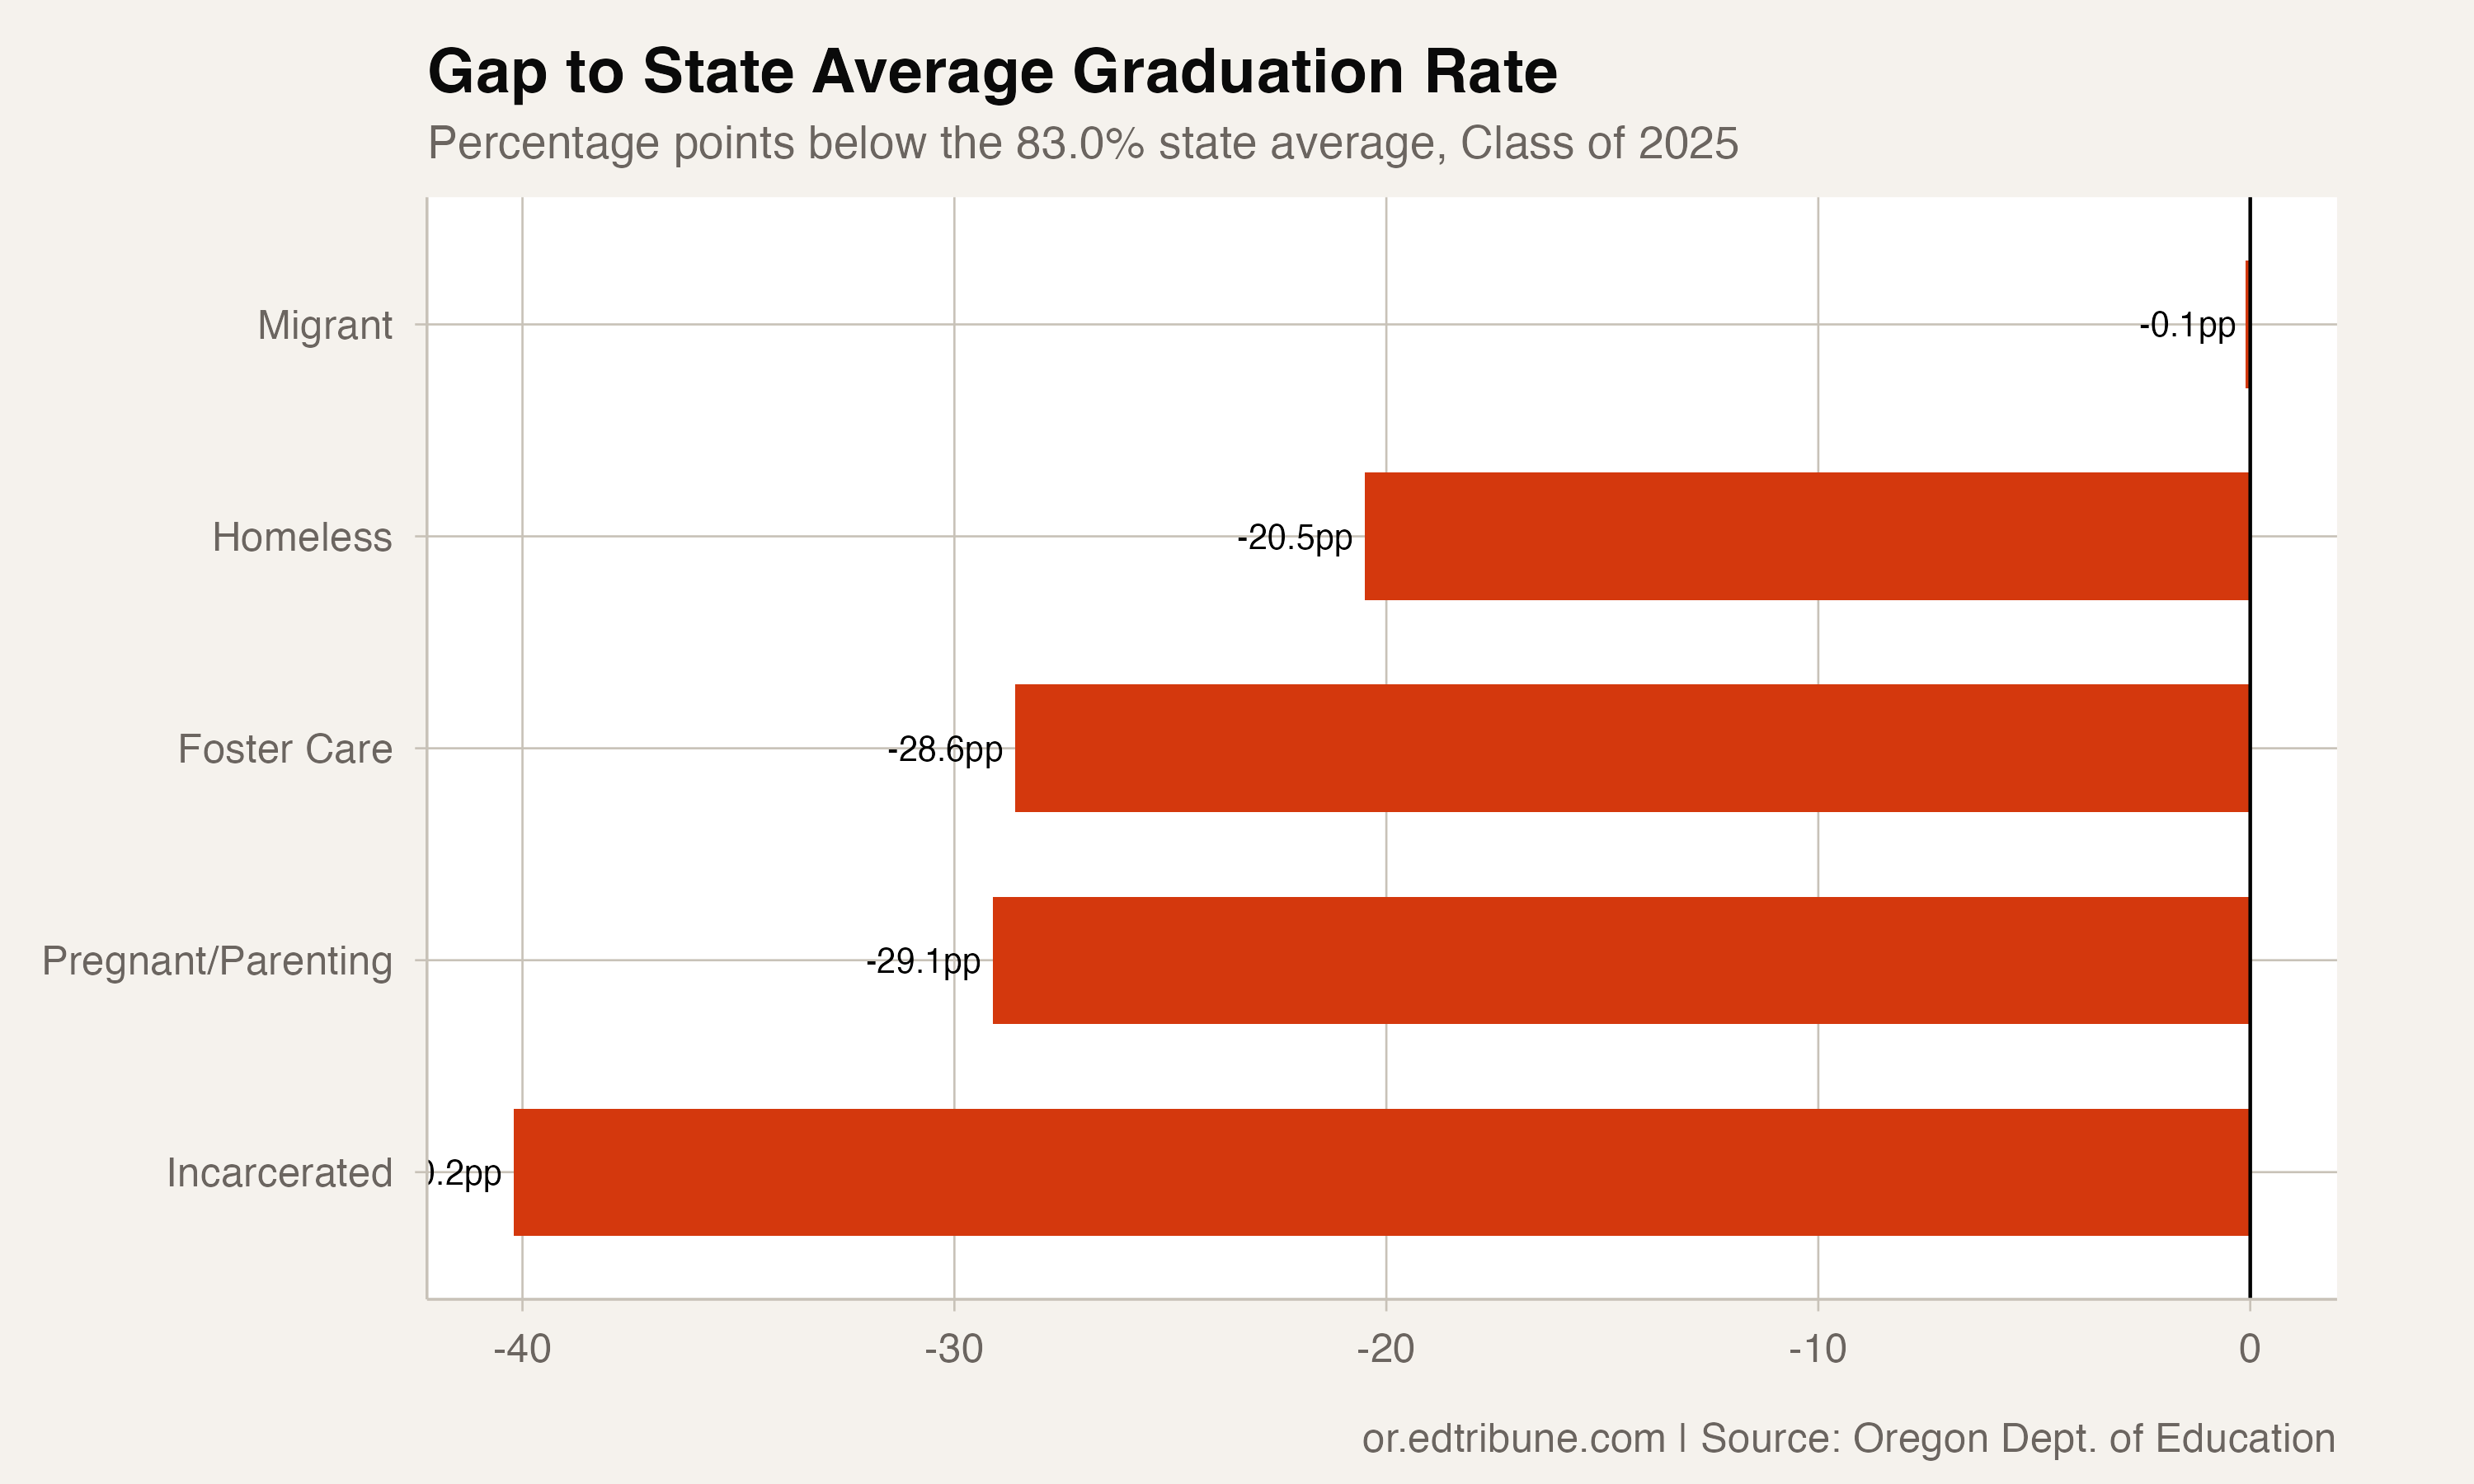
The gaps between the statewide rate and four vulnerable populations were:
- Incarcerated youth: 40.2 points below the state average
- Students who are pregnant or parenting: 29.1 points below
- Foster care youth: 28.6 points below
- Students experiencing homelessness: 20.5 points below
Small improvements, from a low floor
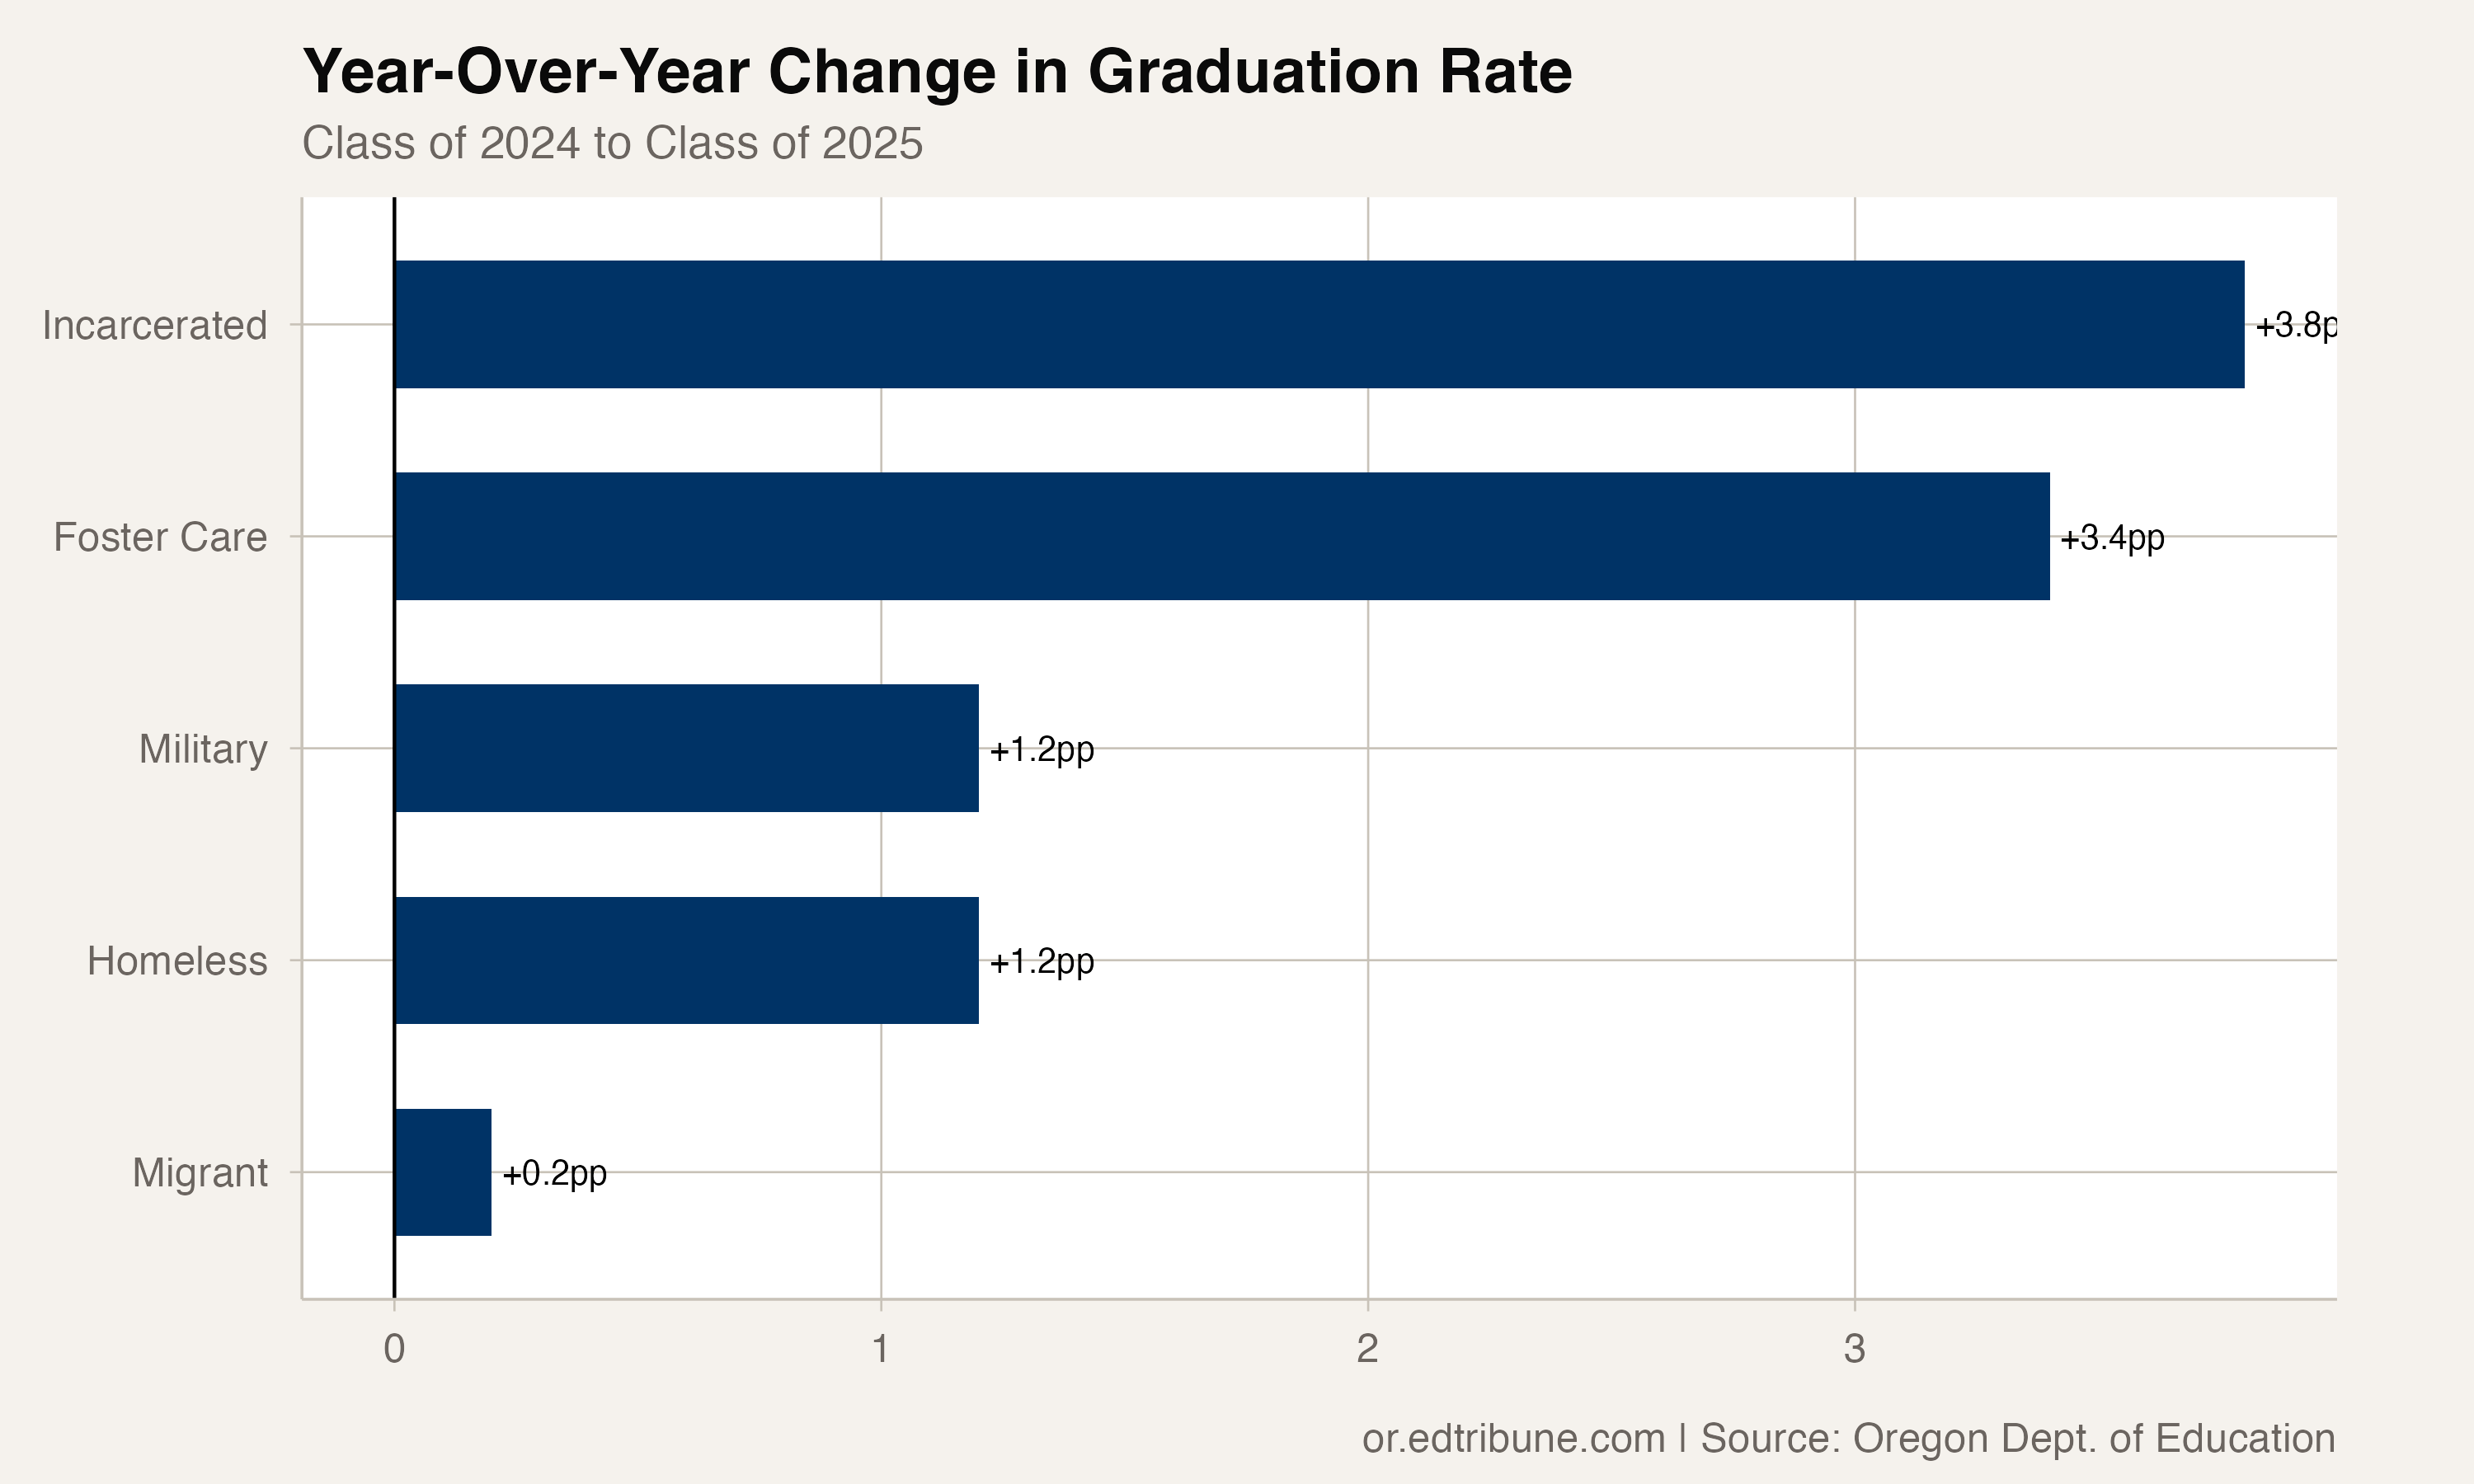
Year-over-year comparisons are available for most of these groups between the Class of 2024 and the Class of 2025. Each of the four groups with two years of reported data increased:
- Incarcerated youth improved 3.8 points (39.0% to 42.9%)
- Foster care youth improved 3.4 points (51.0% to 54.4%)
- Students experiencing homelessness improved 1.2 points (61.3% to 62.5%)
- Students identified as migrant improved 0.2 points (82.7% to 82.9%)
Two years of data are not enough to establish trends. The pregnant/parenting subgroup was not reported for the Class of 2024, so no comparison is available.
What the rows do not show
The state file reports each subgroup separately. It does not provide cross-tabulated rows showing how many students appear in more than one category, so the subgroup cohort counts should not be added and interpreted as a unique-student total.
The data establish the size of the graduation-rate differences and the one-year changes. They do not identify the causes of those differences or show which interventions affected them.
Detailed code that reproduces the analysis and figures in this article is available exclusively to EdTribune subscribers.
Discussion
Sign in to join the discussion.
Loading comments...